time series analysis

All posts tagged time series analysis

UPDATE (2016 Mar 24): The paper is now available for free on astro-ph.

The Astrophysical Journal published today a paper by my colleagues and myself investigating in detail a way to look for moons around transiting exoplanets.

The discoveries of thousands of planets and planetary candidates over the last few decades has motivated a parallel effort to find exomoons. In addition to providing a base of operations for the Empire, exomoons might actually be a better place to find extrasolar life than exoplanets in some ways.

This technique for finding exomoons, called the Orbital Sampling Effect, was developed by René Heller and involves looking for the subtle signature of a moon’s shadow alongside the shadow of its transiting planet host, as depicted in the image below.

At epoch (1), a satellite’s transits just before the planet. At epoch (2), the planet's transit begins, inducing a large dip the measured stellar brightness. At epoch (3), the satellite modifies the planet's transit light curve slightly but measurably.

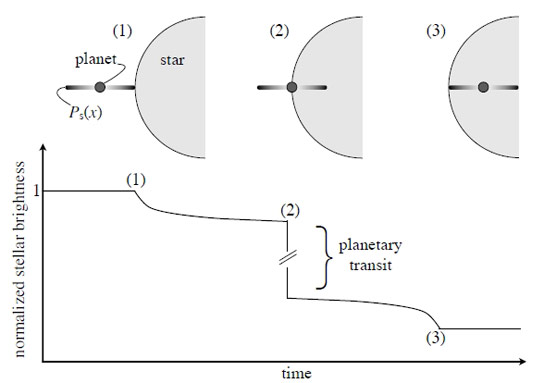
The dark cloud shown around the planet represents the exomoon’s shadow, averaged over several orbits. At epoch (1), a satellite transits just before the planet. At epoch (2), the planet’s transit begins, inducing a large dip in the measured stellar brightness. At epoch (3), the satellite modifies the planet’s transit light curve slightly but measurably.

This simple technique has advantages over alternative exomoon searches in that it doesn’t require significant computational resources to implement. It can also use data already available from the Kepler and K2 missions. However, on its own, the technique can’t provide a moon’s mass, only its size, and it requires many transits of the host planet to find the moon’s quite subtle transit signature.

No exomoon has been found yet in spite of tremendous efforts to find them, so the search continues.


From http://www.redshift-live.com/binaries/asset/image/25908/image/Graviational_Waves.jpg.

From http://www.redshift-live.com/binaries/asset/image/25908/image/Graviational_Waves.jpg.

Nothing. They just waved.

Led by physics major Tyler Wade, this week’s astronomy journal club discussed the very exciting result from the LIGO collaboration, the first detection of gravitational waves.

Einstein predicted the existence of gravitational waves back in 1916. (If your differential geometry and German are any good, you can read the original paper here.) Essentially, gravitational waves are a consequence of that fact that mass can distort the shape of space (that’s what we call gravity).

The upshot of this is that any massive object in motion can excite gravitational waves, but only very massive objects (like, black hole-sized) produce waves big enough that we have any hope of measuring them.

And so for the last few decades, the LIGO project, along with other gravitational observatories, has been monitoring the space-time continuum, looking for tiny distortions due to rapid, oscillatory motion of massive celestial bodies.

LIGO attempts to detect these distortions by sending two laser beams, one each, out and back along two orthogonal 4-km tunnels. By measuring the travel time for each laser beam down each tunnel, they can determine their lengths to a ridiculous precision. A passing gravitational wave would VERY slightly modify the tunnel lengths in a particular way.

How slightly? The signal reported last week by LIGO corresponds to a change in the tunnel length by 0.0000000000000000000001 meters. That’s the equivalent of a change in the width of the Milky Way galaxy by 1 meter.

At two different observatory sites, one in Washington state and the other in Louisiana, the LIGO collaboration measured the distinctive signature of gravitational waves generated by two black holes, many times the mass of the Sun, as they completed their death spiral, merging into an even bigger black hole and radiating an enormous amount of energy.

Why is this important? Well, seeing gravitational waves is not going to allow us to control gravity (at least not yet), and the fact that they exist is not surprising. Instead, LIGO has provided us a brand-new way of doing astronomy.

It’s as if, up until now, we were doing astronomy colorblind, and suddenly LIGO built a color telescope. Of course, being able to see in color would open up vast and unexpected vistas on the universe. The detection of gravitational radiation is the same kind of revolutionary achievement.

NYT has a really great animation and video describing how the detection worked, which I’ve embedded below.

Another attempt at using Gaussian processes to model time series, I’m looking at light curves from active galactic nuclei (AGN). The key thing I’m trying to do here is find and model flaring events.

First, I was interested to see if I could spot outliers representing the peaks of flares, while using a Gaussian processes (GP) model for background variability. The document below shows that attempt. The red band in each plot shows the GP prediction if there were no significant outliers, while the red dots show the outliers. (BTW, the way I embedded the code is very klunky but explained here.)

[gview file=”http://www.astrojack.com/wp-content/uploads/2015/03/looking_for_outliers.pdf”]

Next, I wanted to try to fit one of the apparent flaring events with a model that allowed for correlated noise. To that end, I adapted the example from Foreman-Mackey’s george python module. My solution is shown below. I need to incorporate a variable number of flaring events (I only allowed one for this example), but the model fit worked pretty well. In the second plot below, the blue band shows the range of model fits from the Markov-Chain Monte-Carlo (MCMC) analysis.

[gview file=”http://www.astrojack.com/wp-content/uploads/2015/03/fit_using_GP.pdf”]