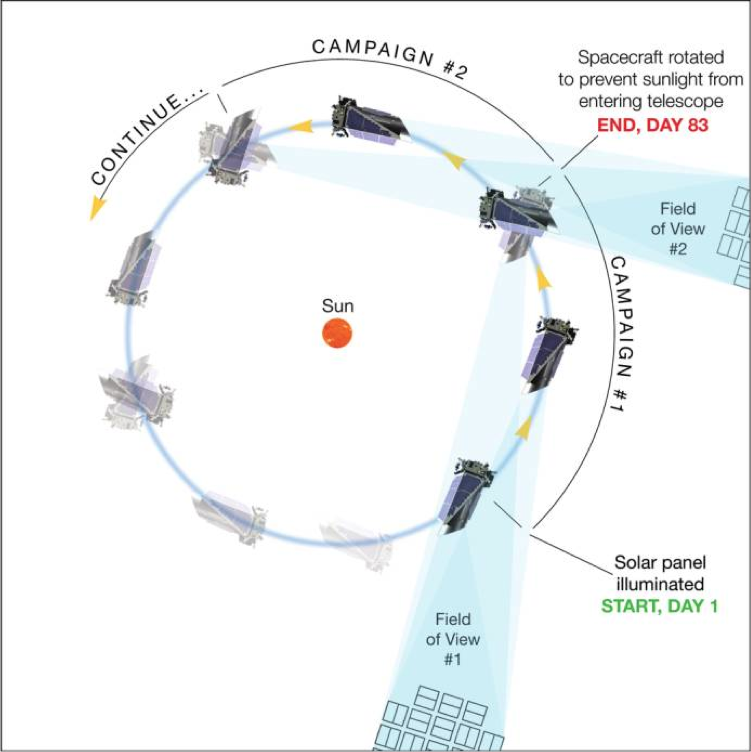
The K2 mission will observe sequential ecliptic campaigns with a duration of ∼83 days, where 75 days are dedicated to science.
I’m a bit late to the game on this one, but I wanted to read Howell et al.’s (2014) paper describing the planned K2 mission, what is essentially the reincarnation of the Kepler mission.
Launched in 2009, the Kepler spacecraft was happily staring at about 150,000 target stars over about 4 years, looking for the shadows of planets as they passed between the Earth and their host star (called planetary transits). Groups using Kepler data have found thousands of planets outside our solar system, revolutionizing exoplanet studies. Unfortunately, two of the reaction wheels used to keep the spacecraft pointing stably at its target field failed by May 2013, ending the nominal science mission.
However, by carefully angling the telescope (see figure at left) and keeping it pointed along its orbital plane, NASA engineers realized they could use the photon pressure from Sun as a sort of third reaction wheel, allowing the astronomical revolution to continue — thus was born the K2 mission, which NASA selected for funding May this year.
The paper from Howell et al. (2014) describes the scientific and engineering capabilities of the K2 mission, which closely match those of the Kepler mission. So a lot of what Kepler could do, K2 can, too. In fact, since mission engineers have to turn the spacecraft every 80 days to satisfy the pointing requirements, K2 will look at lots of different fields on the sky, in contrast to Kepler, which only stared at the same field.
This variable pointing will enable a wider variety of scientific investigations, as discussed by Howell et al., including looking for more transiting planets, but also studies of other galaxies, supernovae, stellar clusters, and more. In fact, the astronomical community submitted more than 100 different ideas of things to do with K2. So the scientists and engineers at NASA have really done a spectacular job salvaging what otherwise would have been a disappointing loss.
