Archives

All posts for the month November, 2013

Interesting talk today from Prof. Hilke Schlichting of MIT’s Earth, Atmospheric and Planetary Sciences Dept. She discussed what we can learn about the histories and origins of planets with all the new planets and planetary candidates found by the Kepler mission.

Artist's conception of a large planetary impact. From http://www.hdwallpapersinn.com/planet-impact-wallpapers.html.

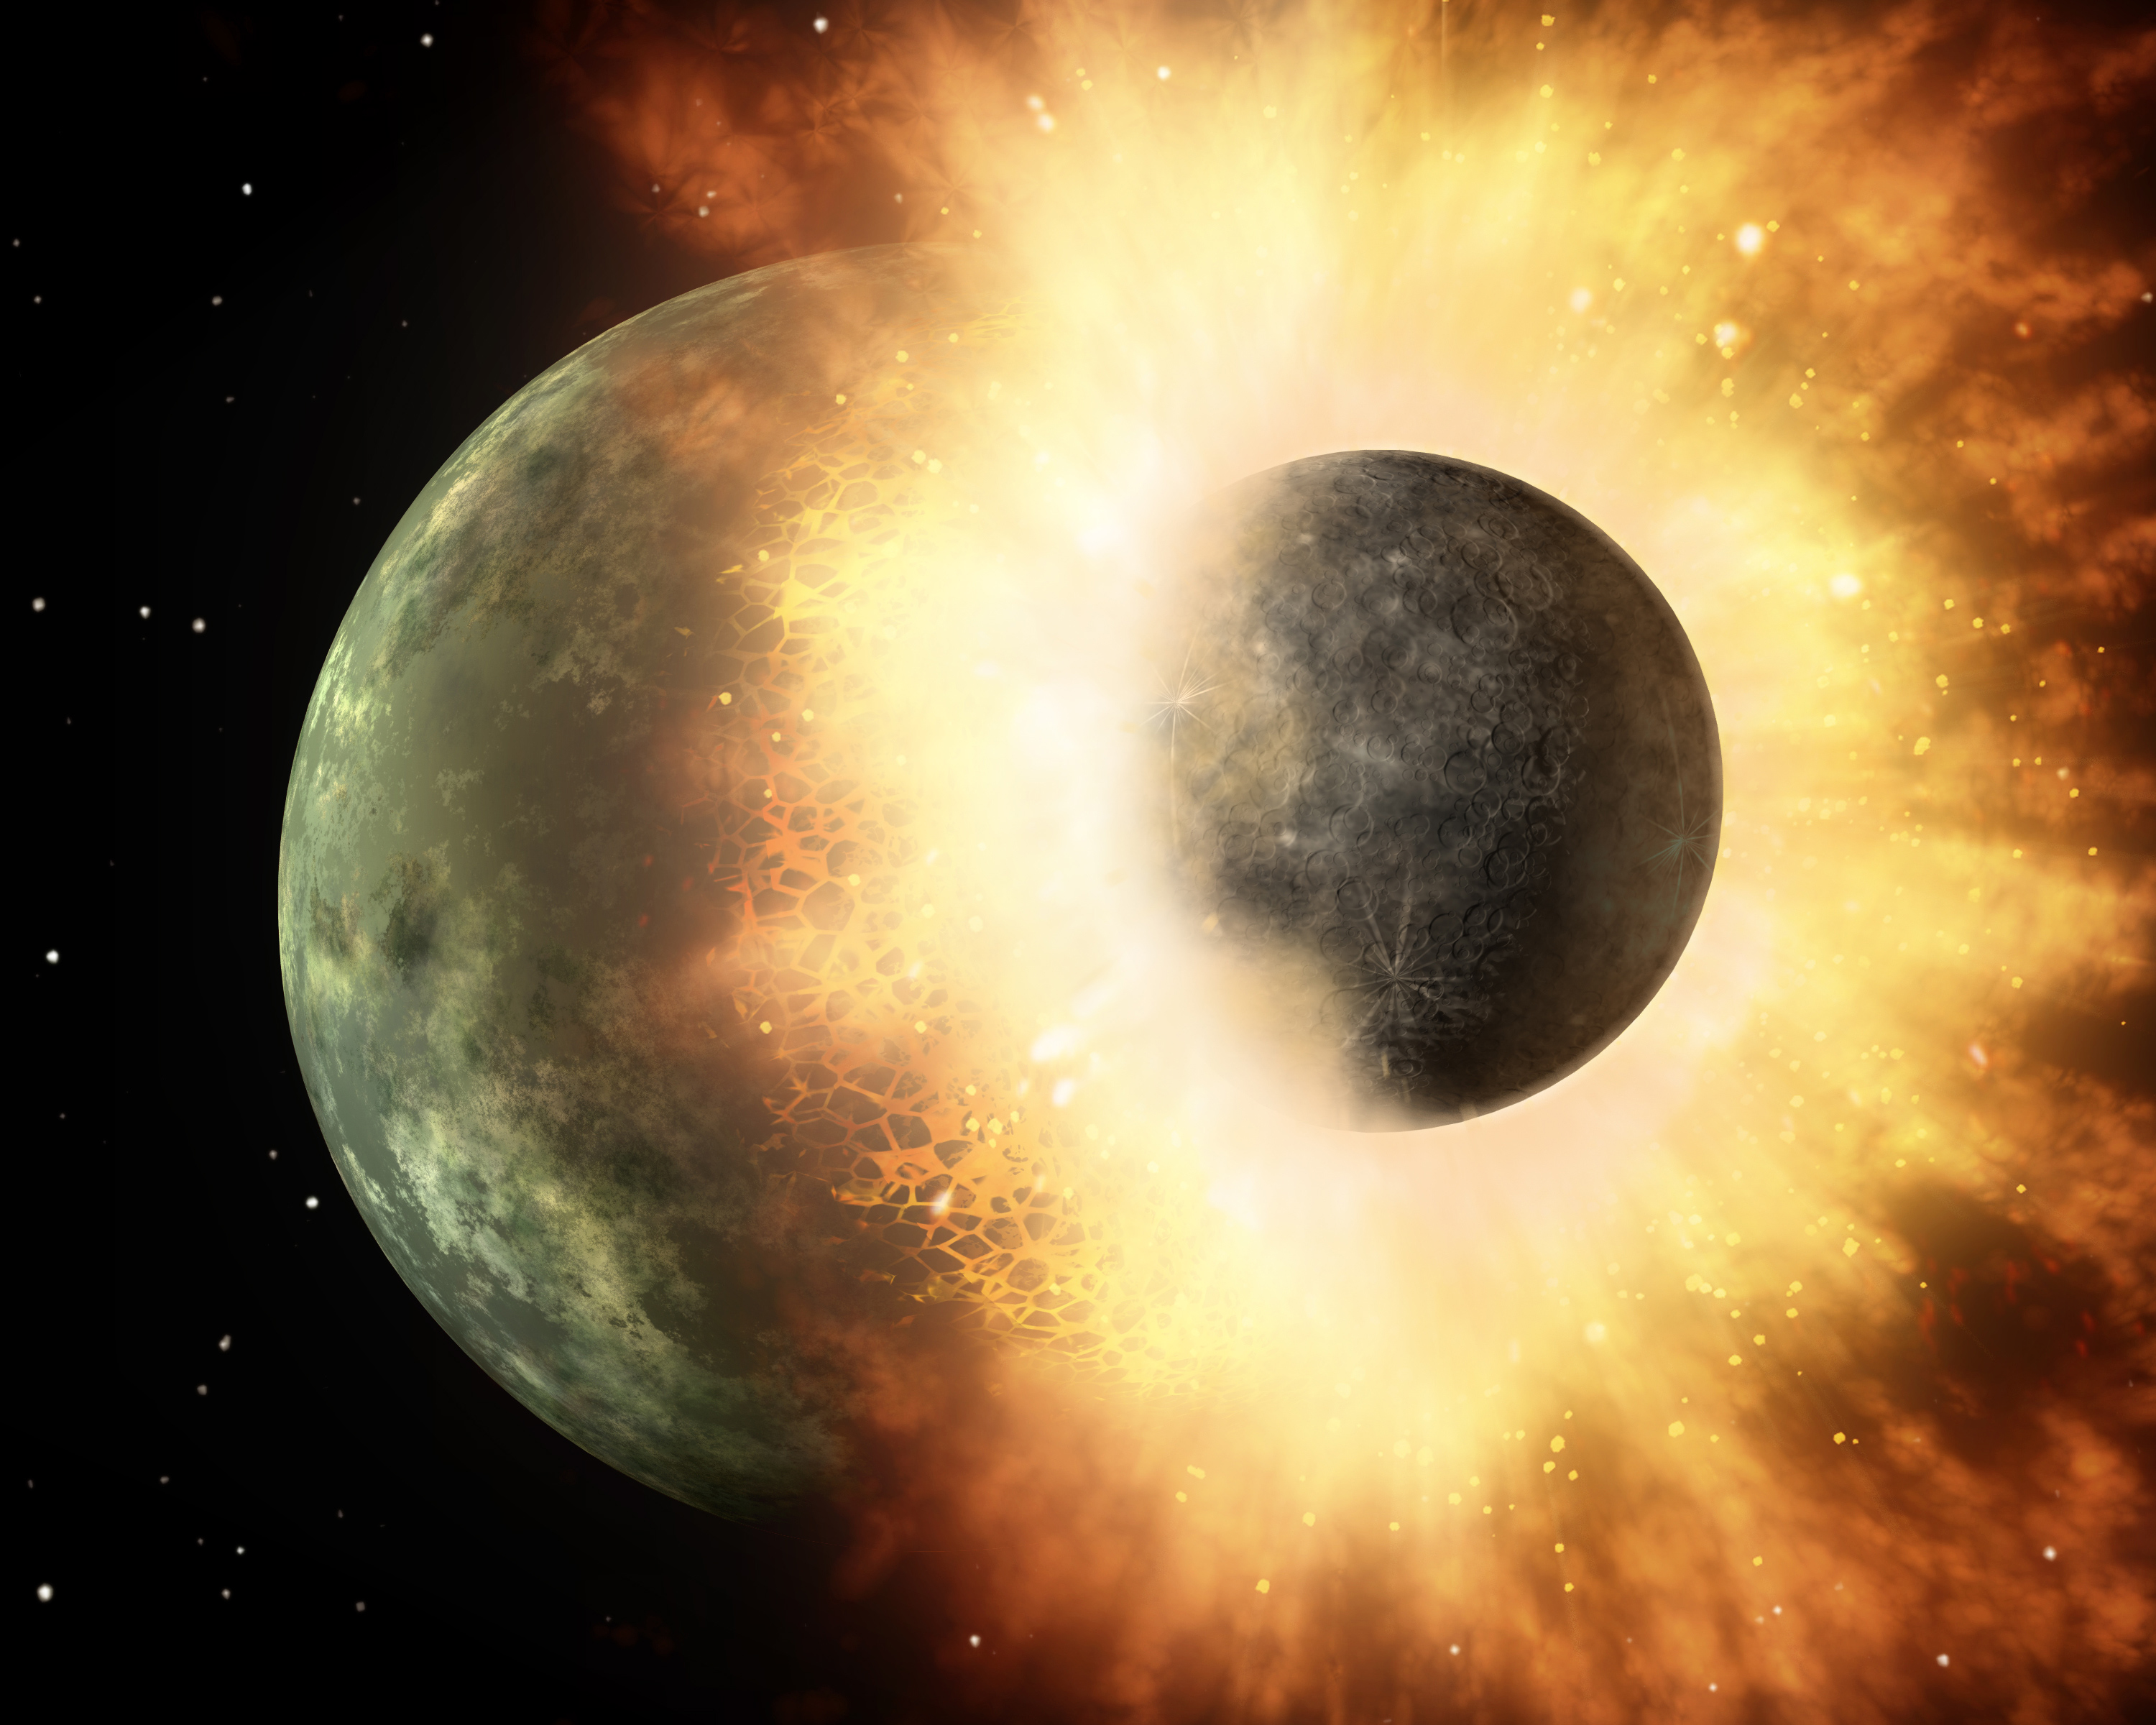
Artist’s conception of a large planetary impact of the kind that occurred during planet formation. From http://www.hdwallpapersinn.com/planet-impact-wallpapers.html.

Among the key results from Kepler are discoveries of a wide variety of orbital architectures (the arrangements of planetary orbits). The processes that gave rise to the planets determined, for example, the orbital periods of the planets.

Many Kepler planets reside in systems with multiple planets, and many members of these multiplanet systems have orbital periods that are very nearly integer multiples of one another. That is, the planets are near a mean-motion resonance, which means the planets interact strongly gravitationally.

Prof. Schlichting described one explanation for these near resonances: while the planetary systems were still very young, interactions between the nascent planets and the protoplanetary gas disks from which the planets form gently tuned the gravitational interactions between the planets, keeping them slightly out of resonance.

There has been some debate about whether the near resonances for many Kepler planetary systems mean that the planets did or did not undergone strong gas disk migration. In the simplest picture, this migration should drive planets into resonances, inconsistent with the observations of near-resonances.

But Prof. Schlichting’s modification to that picture means that the planets could have undergone migration after all. Turns out planetary systems were pretty complicated, dynamic places early on.

P/2013 P5 as seen by Hubble on September 10, 2013. P/2013 P5 is about 790 feet (240 m) in diameter. It has six comet-like tails of dust radiating from it like spokes on a wheel. From http://www.sci-news.com/space/science-p2013p5-hubble-asteroid-six-tails-01530.html.

The comet P/2013 P5 as seen by Hubble on September 10, 2013. P/2013 P5 is about 790 feet (240 m) in diameter. It has six comet-like tails of dust radiating from it like spokes on a wheel. From http://www.sci-news.com/space/science-p2013p5-hubble-asteroid-six-tails-01530.html.

At journal club today, we talked about two interesting papers.

The first, “The Extraordinary Multi-tailed Main-belt Comet P/2013 P5” by Jewitt and colleagues, discussed observations using the Hubble Space Telescope of a comet in the asteroid belt that displayed five cometary tails (see image at left). The tails are made of particles shed by the comet, and using the particle trajectories inferred from the tails, the authors were able to figure out when, over the last few months, the particles were launched from the comet.

The second article, “Evidence for high salinity of Early Cretaceous sea water from the Chesapeake Bay crater” by Sanford and colleagues, presented chemical analyses of water collected from under the Chesapeake Bay, in the large impact crater at the southern end of the bay. (The crater is underwater and buried by sediment, so you can’t see it even if you’re just standing on it.) The water contain subtle chemical signatures that indicate it was originally part of the Early Cretaceous North Atlantic Ocean, an extinct ocean from more than 100 million years ago. Chemical analyses of this buried water will tell scientists what the ancient ocean was like.

The images were created using observations from the Spitzer SINGS survey and the Herschel KINGFISH survey. Rather than stars, the images show dust between the stars, which is created by dying stars and forms some of the material from which stars are formed. The colour images are made by combining three different wavelengths. From http://www.astro.umd.edu/~rhc/bigbang/boxed/research_blog.html.

The images of many different kinds of galaxies were created using observations from the Spitzer SINGS survey and the Herschel KINGFISH survey. From http://www.astro.umd.edu/~rhc/bigbang/boxed/research_blog.html.

For today’s astronomy seminar, we had Rodrigo Herrera from University of Maryland Astronomy. Rodrigo spoke about using far infrared observations from the Herschel instrument to study star formation in nearby galaxies.

Rodrigo talked about using emission at 158 microns, created by ionized carbon atoms (CII), to probe the rates of star formation. The hottest and youngest stars in a stellar nursery, O and B stars, are thought to heat dust grains, charging them slightly. The resulting excess electrons then escape into the gas surrounding the stellar nursery, heating it. Some of that gas is ionized carbon, which cools by emitting photons at a very specific wavelength, 158 microns.

By observing how much 158-micron emission is coming from a galaxy (and applying some important corrections to account for the variation in the physical environments in each star-forming region), Rodrigo showed that astronomers could pretty accurately estimate the rate at which stars are forming throughout that galaxy.

Understanding the star formation rate is important for may aspects of astronomy, but in particular, the star formation rate is a key parameter for the Drake equation, which estimates the number of intelligent and communicating civilizations in the universe. Such civilizations probably grow up orbiting a star similar to the Sun, so knowing how often such stars form goes a long way to telling us how many extraterrestrial civilizations might be out there.


Interesting seminar today from Prof. Richard O’Connell of Harvard Geophysics. Prof. O’Connell discussed the interplay between the thermal evolution of the Earth’s interior and plate tectonics.

Flow structure of the convection cell in a model of the Earth's interior. Figure 3 from Crowley & O'Connell (2012) -- http://adsabs.harvard.edu/abs/2012GeoJI.188...61C.

Flow structure of the convection cell in a model of the Earth’s interior. Figure 3 from Crowley & O’Connell (2012) — http://adsabs.harvard.edu/abs/2012GeoJI.188…61C.

New models from Prof. O’Connell and his student John Crowley suggest that the Earth may have undergone different stages of tectonic evolution, with the tectonic plates moving quickly at some times in the Earth’s history but much more slowly at others.

The evolution between different geophysical modes may help explain a longstanding puzzle in Earth science: the amount of heat coming out of the Earth is much greater than expected and has been thought to require much more heating from radioactive isotopes than geochemical analyses allow.

If, instead, O’Connell and Crowley are right, then this large heat flow is really just a symptom of Earth’s geophysical fickleness: sometimes lots of heat comes out, other times less.

We had a great talk at DTM today from Dr. Mark Wieczorek, a geophysicist from the Institut de Physique du Globe de Paris.

Total magnetic field strength at the surface of the Moon as derived from the Lunar Prospector electron reflectometer experiment. From http://en.wikipedia.org/wiki/File:Moon_ER_magnetic_field.jpg.

Total magnetic field strength at the surface of the Moon as derived from the Lunar Prospector electron reflectometer experiment. From http://en.wikipedia.org/wiki/File:Moon_ER_magnetic_field.jpg.

He talked about the geophysical history of the Moon as inferred from remnant magnetic fields in lunar rocks.

Currently, the Moon does not have a large-scale magnetic field, as the Earth does, but there are smaller-scale magnetic anomalies (see figure at right). These remnant magnetic signatures probably indicate that long ago (about 3-4 billion years ag0) that Moon DID have a magnetic field.

So why did the Moon have a magnetic field long ago and why doesn’t it anymore? One exotic idea Dr. Wieczorek talked about was the idea that large asteroidal or cometary impacts could disrupt the rotation of the Moon’s mantle.

As a result, the mantle and core would rotate at different rates in different directions, which could stir up and heat fluid in the Moon’s interior. This heating could drive internal convection and produce a magnetic field, similar to the way the magnetic field in the Earth is generated.

Relative strengths of known diffuse interstellar bands. From http://en.wikipedia.org/wiki/File:Diffuse_Interstellar_Bands.gif.

Relative strengths of known diffuse interstellar bands. From http://en.wikipedia.org/wiki/File:Diffuse_Interstellar_Bands.gif.

We had a great talk today from Dr. Gail Zasowski of Johns Hopkins University Astronomy. She talked about mysterious spectral features called diffuse interstellar bands (or DIBS).

Illustrated at left, DIBs are spectral absorption features that pop up when astronomers point their telescopes in almost any direction in the sky. The DIBs are probably created by some type of molecule (or molecules) that abounds throughout our galaxy, but astronomers and astrochemists haven’t figure out what it is yet, even after decades of work.

Dr. Zasowski described how the DIBs could be identified in the vast collection of spectra from the APOGEE project and then used to map structure in the Milky Way. It goes to show that, just because we don’t know what exactly we’re looking at, it doesn’t mean astronomers can’t use the information to learn about the universe.