BSU Journal Club

Martian dunes west of the giant Hellas impact basin and observed by the High Resolution Imaging Science Experiment (HiRISE) camera on NASA’s Mars Reconnaissance Orbiter. From https://www.nasa.gov/multimedia/imagegallery/image_feature_1569.html.

Mars is a dry, dusty place, with globe-girdling sand seas, mile-wide dust devils, and frequent world-wide dust storms.

In spite of the ubiquity of dust on Mars, though, the physics of dust-lifting and transport remain mysterious. For instance, the seasonal appearance of dark streaks on slopes across the surface of Mars, called recurring slope lineae, were thought to result from flow of brine. Recently, though, we’ve found they are more likely granular flow, but what exactly drives their seasonality is unknown.

Warm-season features originally thought to be evidence of salty liquid water active on Mars today. More recent studies show they are very probably granular flow. From https://en.wikipedia.org/wiki/Seasonal_flows_on_warm_Martian_slopes.

Experiments conducted by the aeolian physics group at University of Duisburg-Essen has brought a little clarity to the mystery of martian dust.

One of the biggest challenges for experiments exploring martian dust transport is replicating Mars’ low gravity (40% of Earth’s) and air pressure (10% of Earth’s). Since gravity and pressure help determine how winds move dust, accurate experiments must somehow create winds in a low-gravity environment under near vacuum.

To make a little pocket of Mars on Earth, Maximilian Kruss and colleagues took a small vacuum chamber centrifuge onto a “vomit comet” and conducted parabolic flights to create short periods of microgravity.

Kruss and colleagues’ low-pressure, microgravity chamber. From Kruss et al. (2019).

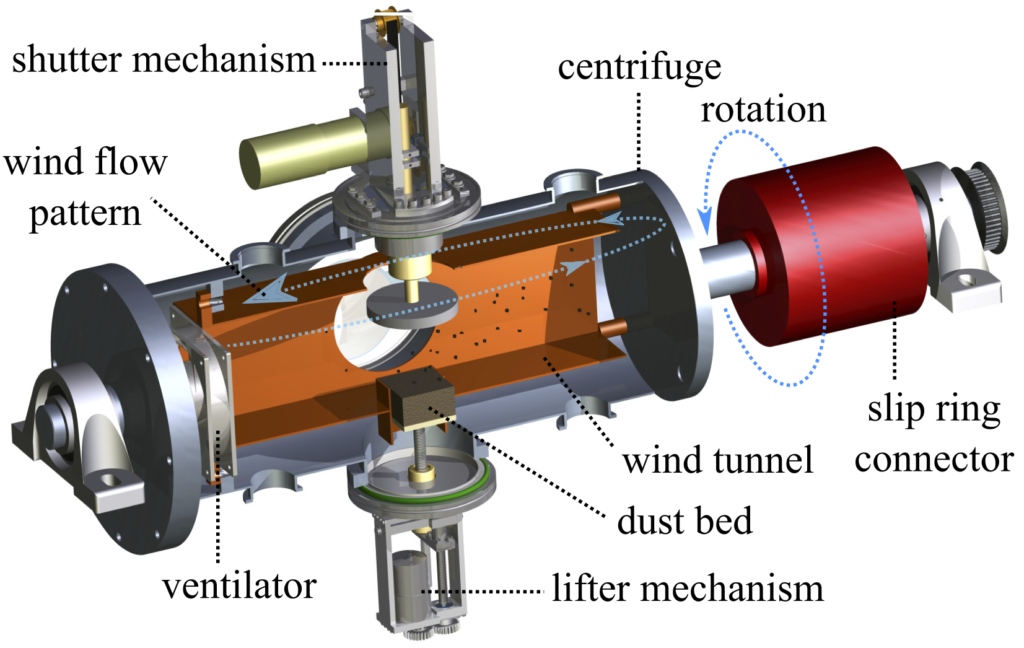
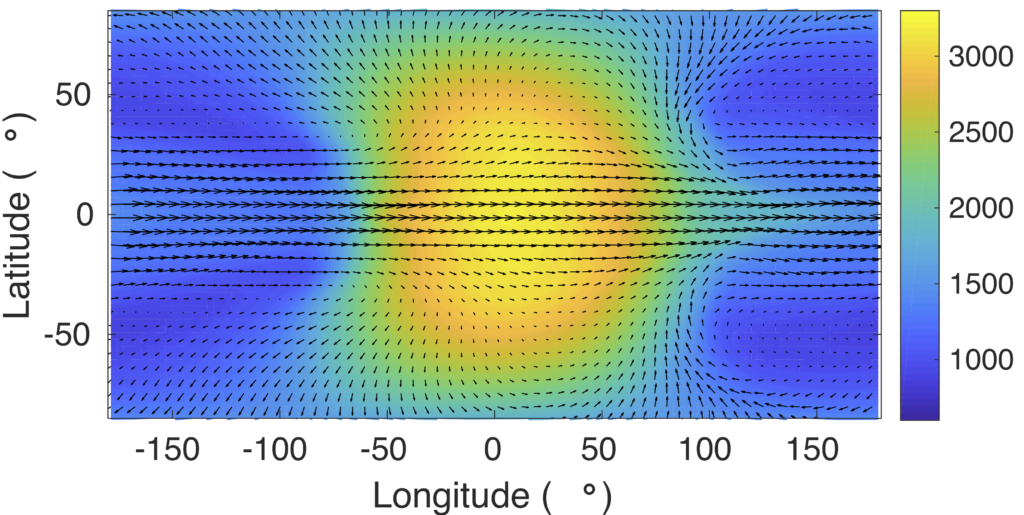
They filled the chamber with martian-like dust grains and turned up the fan to figure out when the winds were strong enough to start blowing the dust. By imaging the grain bed and tracking the grains, they estimated this threshold wind velocity, which is key to understanding when and where Mars can blow dust around.

Video of grains blowing across a chamber bed. From https://www.uni-due.de/physik/agw/research.php.

Kruss and colleagues found, reassuringly, that theoretical models about dust transport were accurate. These results help us understand aeolian processes on a wide range of bodies, not only on Mars but any body with a low-pressure atmosphere.

Dunes (left) and wind streaks (right) on the surface of the comet 67P as seen by the Rosetta Mission. From https://sci.esa.int/web/rosetta/-/55308-ripples-and-wind-tails.

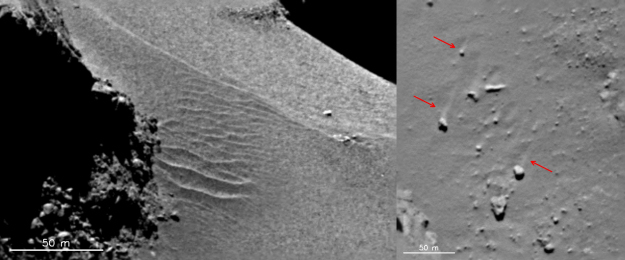
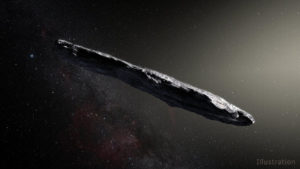
Indeed, even comets play host to aeolian processes. When the Rosetta Mission flew past comet 67P, it saw features on the comet’s surface that looked for all the world like wind streaks and dune fields.

Kruss and colleagues suggest dust transport may be important on some exoplanets, where gravities and atmospheric pressures span an even wider range than in our solar system. And so, these results, taken from a tiny vacuum chamber, may bear on processes on worlds across the whole galaxy.

Hot Jupiters are gas giant planets like Jupiter but orbiting so close to their host stars that they can be as hot as small stars. In fact, some suffer such strong irradiation that their atmospheres are being blasted off into space. These objects were among the first exoplanets detected, and their origins and fates remain unclear.

Being so hot, their atmospheres are also unlike any planet’s in our solar system, but we can be certain that, with temperatures hot enough to vaporize rock, the weather on these planets is highly dynamic. The video below shows what happens to one such planet as it gets blast-roasted by its host star – a giant thermal wave screams around the planet.

An animation showing meteorological chaos on HD80606b.

Weather forecasts on hot Jupiters would to have keep track of super-sonic winds, ruby rain, and warm fronts heated by magnetic fields. And a recent study using observations from the Hubble Space Telescope shows that these dynamic atmospheres remain mysterious.

Led by Jacob Arcangeli of the University of Amsterdam, the study used the Wide-Field Camera onboard Hubble to watch WASP-18 as the hot Jupiter circled its star.

As the planet swings revolves around its star, we see first the cool nightside of the planet and then the blistering dayside. By measuring the diurnal cycle of infrared light emitted from the two sides of the planet, called the phase curve, Arcangeli and colleagues were able to measure their respective temperatures and learn something about the planet’s weather.

The phase curve of WASP-18b measured by Hubble (shown in blue), along with model fits.

The figure above shows WASP-18b’s phase curve as blue points and a model fit to the data as a black line. By applying computer simulations for the planet’s weather, Arcangeli and colleagues estimated what they expected the phase curve to look like various assumptions about the planet’s composition and atmospheric dynamics.

A map of atmospheric temperatures (in degrees Kelvin) in WASP-18b’s atmosphere.

Using their models, they were able to draw a rough map of temperatures in WASP-18b’s atmosphere (shown above), like a weather map for the Earth. Like most hot Jupiters observed show far, the hottest place in WASP-18b’s atmosphere lies a little east of the point that receives the most sunlight, the substellar point. That’s because high windspeeds blow the strongly heated gas away toward the east, a little like the jet stream on Earth.

However, the winds inferred from the Hubble observations weren’t as strong as expected from the model, suggesting there is some form of drag or friction in WASP-18b’s atmosphere.

The likely culprit: the planet’s very own magnetic field. Gas in WASP-18b’s atmosphere is actually so hot, it can become somewhat plasma-fied, and plasma, consisting of hot charged particles, can interact with the hot Jupiter’s magnetic field.

This is totally unlike planets in our own solar system, where the atmospheres are comparatively cool and none of the gas has turned into plasma.

The upshot of this result is that we may be able to use observations of the meteorology on distant worlds to learn something about the planets’ magnetic fields, which originate deep inside the planet. So their weather may allow us to plumb the depths of these distant worlds.

Artist’s conception of Neptune’s newest moon Hippocamp.

In our research group meeting this week, we discussed the recent discovery of a new moon orbiting Neptune, named after Poseidon’s chimerical winged pega-fish Hippocamp.

Hippocamp is about 12 km across, so small and dim that it wasn’t seen when Voyager 2 flew past in 1989, back when the B-52s were heading down the Atlanta Highway. In fact, Showalter and colleagues had to use high-precision Hubble observations and a new data-processing approach to spot the little moon circling Neptune just interior to another moon Proteus.

This composite Hubble Space Telescope picture shows the location of a newly discovered moon, designated S/2004 N 1, orbiting the giant planet Neptune. From https://en.wikipedia.org/wiki/Hippocamp_(moon)#/media/File:S-2004_N1_Hubble_montage.jpg

Hippocamp orbits so close to Proteus that Showalter and colleagues suggest it may have originated from this larger moon in a massive collision. That same collision may have created Proteus’ enormous impact basin Pharos, and Showalter suggests that collision would have liberated debris, some of which later accreted interior to Proteus’ orbit to form Hippocamp.

If Hippocamp really did form from such an impact, it has probably experienced numerous disruptive collisions itself over its billion year history. Based on studies of the frequency of large cometary collisions out near Neptune’s orbit, Showalter and colleagues estimate that Hippocamp may have been disrupted and re-accreted about 9 times in the last 4 billion years.

Having risen from its own ashes so many times, Hippocamp may be less like a mythical sea-horse and more like a cynthian phoenix.

Artist’s conception of a hot Jupiter shedding mass.

The very first exoplanet discovered around a Sun-like star, 51 Peg b, was a shocker – it’s a giant planet like Jupiter made mostly of hydrogen and helium but 100 times closer to its sun than Jupiter is to ours and whizzes around its orbit every 4 days.

Indeed, when its discoverers Michel Mayor and Didier Queloz first spotted the telltale spectral wobble of a planet in a 4-day orbit, they didn’t believe their discovery. At the time, everyone knew (or thought they knew) that planets like Jupiter could only form very far away from their host star.

Worse, so close to its star, 51 Peg b’s was being super-heated, and Mayor and Queloz worried that such a hot gas giant might quickly lose its hot, bloated atmosphere. And in their discovery paper, they suggested that the giant planet we see today as 51 Peg b might have started out as a brown dwarfthat shed trillions and trillions of lbs.

Later studies showed those early concerns about atmospheric blow-off were overblown and planets as massive as 51 Peg b, even if they are as scorched, probably can’t lose more than a fraction of their original mass. Since then, hot Jupiters like 51 Peg b, while cosmically rare, have become a fairly common type of exoplanet discovery.

But that doesn’t mean these planets aren’t losing a lot of mass, and a recent study from David Sing and colleagues looks at one of the mass-losing-est planets we know of, WASP-107b

Artist’s conception of WASP-107b transiting its host star.
From https://en.wikipedia.org/wiki/WASP-107b.

Sing and colleagues collected transit observations in infrared wavelengths of the WASP-107 system using the venerable Hubble Space Telescope. By looking in the infrared, they could search for the spectral signals of different gases in WASP-107b’s atmosphere.

WASP-107b is an especially good target for atmospheric characterization because its host star is very bright (compared to other planet hosts) and the planet itself is very low density – it has a mass a tenth that of Jupiter’s but a radius almost as big, giving the planet a density comparable to wind-packed snow.

With such a low density, WASP-107b’s atmosphere is puffy and distended, which means that its atmospheric gases can easily imprint their spectral signatures on the light observed by Hubble, making them easy to detect.

And for the first time in any exoplanet, Sing and colleagues saw signs of helium gas in WASP-107b’s atmospheric spectrum. In fact, the helium signal they saw was so whopping big that it suggests WASP-107b’s atmosphere is actively escaping, at a rate of about 10,000 tons per second.

Escape of WASP-107b’s atmosphere. The planet is the small grey circle near bottom, the star is the yellow circle, and the escaping atmosphere is shown in blue. The black line is the planet’s orbit. From Sing et al. (2018).

Even with such a high escape rate, WASP-107b won’t fall apart anytime soon – Sing and colleagues estimate it would only lose about 4% of its mass in a billion years.

But as we continue to find more exoplanets, we should probably expect to find more even closer to their host stars with even puffier atmospheres, perhaps some on the verge of being gravitationally ripped apart. So as with 51 Peg b’s discovery, exoplanets are likely to keep challenging our preconceived notions about where planets can and cannot be.

On Cowboy Bebop’s Titan, troops advance across a fictitious dune field that turned out not to be so fictitious.

Arguably the best animé of all time, “Cowboy Bebop” is set in a not-too-distant future, when humans inhabit planets and moons across the solar system. In fact, one of the moon inhabited, Saturn’s moon Titan, features as the site of a violent, Desert Storm-like battle among sand dunes and scorpions.

“Cowboy Bebop” aired in Japan in 1998-1999, about a year after NASA launched the Cassini-Huygens mission to explore the Saturn system, including Titan. Shortly after arriving at Saturn, Cassini began collecting infrared observations of Titan, allowing scientists to peer through Titan’s hazy atmosphere. They found a surprisingly Earth-like world — violent but irregular storms (albeit of methane and ethane) and vast seas (primarily confined to the poles).

Scientists also found expansive dune fields girding the equator. Unlike terrestrial dunes, which are made mostly from silicate grains, these dunes were made (somehow) from carbon- and ice-rich particles. And an even more recent analysis of Cassini observations shows that Titan has something else in common with Earth: large dust storms.

In their study from late last year, Sébastien Rodriguez, an astronomer at the University Paris Diderot, and co-authors looked at maps of Titan collected by Cassini’s VIMS instrument and found that, over the dune regions, a large bright feature appeared and disappeared several times over the course of a few weeks.

Figure 1 from Rodriguez et al. (2018) showing the dust storm, indicated by the white arrow.

Now, just because there is a bright spot on Titan that changes with time does NOT mean it has to be a dust storm, but Rodriguez and colleagues go to great lengths to show that other explanations don’t fit.

For instance, previous observations of Titan found equatorial clouds that produced downpours of methane and ethane on the surface. Superficially, these clouds resembled Rodriguez’s putative dust storms.

Methane Rain Possible on Titan. From APOD.

But Rodriguez’s dust clouds can only be seen in the few wavelengths of infrared light that are known to penetrate Titan’s atmosphere all the way to the ground. Storm clouds can be seen even in wavelengths that don’t reach the ground since they ascend high into the atmosphere.

Rodriguez and colleagues are even able to estimate the size of the dust grains — the dust clouds are much easier to see at 5 micron-wavelengths than at the shorter wavelengths that also probe to Titan’s surface. That probably means the grains are about 5 microns.

If Titan’s dust really is that small, it’s much smaller than sand grains and even smaller than the dust we usually see on Earth. It turns out that the aerodynamic behavior of a wind-blown particle depends, among other things, on its size. For a planet with a given atmospheric density, winds are good at blowing particles of a specific size — too small and the particles stick together; too big and the wind can’t lift the particles.

Rodriguez and colleagues estimate that windspeeds of about 3+ meters per second (about 7 miles per hour) would required to loft 5-micron dust grains on Titan. That may seem small, but the winds measured by the Huygens probe during its descent onto Titan measured even weaker near-surface winds of less than 2 meters per second.

However, the study’s authors point that stronger winds probably accompany Titanian rain storms. If such a storm had just taken place before they spotted the dust cloud, that could easily explain how the dust was lofted.

Ultimately, answering the question of Titan’s dust storms will require visiting the world again. Fortunately, NASA is investigating sending an automated drone to fly the Titanian skies, the Dragonfly mission, back to Titan in 2025. Whether that mission flies or not will be decided later this year.

Artist’s conception of ‘Oumuamua.

The recent visit to our solar system by the interstellar object ‘Oumuamua has raised considerable controversy in the scientific community. Based on the fact that it is moving too fast to be trapped in an orbit around the Sun, ‘Oumuamua is the first object confidently identified as originating from outside our solar system. Its origin is unclear, and one likely possibility is that it is debris ejected from another planetary system. But Avi Loeb, chair of astronomy at Harvard, has proposed a more exciting but understandably controversial idea: ‘Oumuamua may be a probe from an alien civilization.

The idea’s not as crazy as it sounds — since interstellar distances take so long to cross (with current technologies, it’s at least 20 years to *our* nearest stellar neighbor), we think aliens are likely to explore using automated spacecraft rather than sending themselves.

And ‘Oumuamua did behave strangely during its short visit to our solar system. As it rounded the Sun, astronomers observed an anomalous acceleration inconsistent with the pull of the Sun’s gravity. For comets, such accelerations are common and attributed to jetting from vaporizing ice. But astronomers saw no evidence for such jetting from ‘Oumuamua. In addition, ‘Oumuamua has a funny shape, perhaps resembling a cigar, unusual but not totally impossible for a comet-like body.

Loeb has explained these anomalies by proposing that ‘Oumuamua is an alien solar sail, harnessing the radiation pressure from the Sun to navigate the cosmos. Such solar sails may be a low-cost, efficient means of plying the interstellar waters and have featured in recent technology demonstrations from the Planetary Society. If ‘Oumuamua were, indeed, a solar sail, that might explain both the anomalous acceleration and the unusual shape.

Fig. 1 from Bialy & Loeb (2019). The maximum distance a solar sail can travel L_max depends on the sail’s mass-to-area ratio, m/A, but Bialy and Loeb’s calculation suggest ‘Oumuamua could safely traverse the entire Milky Way.

One potential problem for is that, to work, a solar sail must be very light-weight and thin – the Planetary Society’s LightSail 2 spacecraft is a square almost six meters to a side, but weighing less than a bowling ball. It’s easy to imagine that such a cosmic tissue might not survive the rigors of interstellar travel. And so in a recent paper, Shmuel Bialy and Avi Loeb conduct a series of back-of-the-envelope calculations to argue that the interstellar rigors might not be so rigorous.


One of the biggest hazards for a solar sail would collisions with interstellar dust and gas – each collision could sap ‘Oumuamua’s momentum and vaporize its surface. However, Bialy and Loeb estimate that a solar-sail ‘Oumuamua could plausibly traverse tens or hundreds of kiloparsecs before such collisions would be a problem. That means ‘Oumuamua could cross the entire Milky Way before suffering a mission-ending number of collisions.

As compelling as their calculations are, my instinct (and that of most astronomers) is that ‘Oumuamua is something more mundane than an alien craft. But the conversation catalyzed by Loeb’s suggestions is probably healthy for the field of SETI, and certainly the public enthusiasm is encouraging – people love space and want desperately to find extraterrestrials.

The challenge is to keep these debates firmly scientific, to strike a balance between pushing the envelope and tearing the envelope to shreds. And the line between science and pseudo-science in the realm of alien life can be as tissue-thin as a solar sail.

The Earth is an ocean world, and geological evidence in the form of ancient, indestructible zircon mineral grains indicates the Earth has had liquid water on its surface going almost back to its beginning.

The persistence of Earth’s oceans is surprising since stars like the Sun brighten with age as they gravitationally contract. In fact, in 1972, Sagan and Mullen showed that, 2.3 billion years ago, the Sun should have been about 15% dimmer than today — dim enough that, if the atmosphere resembled today’s, the Earth should have frozen over. But somehow, it didn’t.

Evolution in the past of the Sun’s luminosity (top) and mass (bottom) for different scenarios. From Spaulding et al. (2018).

A recent study by Spaulding, Fischer, and Laughlin explores one possible solution of the famous “faint young Sun paradox” — over 4.5 billion years, the Sun has been slimming down.

All stars like the Sun lose mass over billions of years through stellar (or solar) wind. This flood of hot, charged particles continually escapes from a star’s atmosphere, streaming into space. (When the solar wind strikes the Earth’s atmosphere, it gives rise to aurorae.)

Even though the Sun’s stream is currently more breeze than wind, it was probably much stronger billions of years ago, removing perhaps 1% of the Sun’s original mass over the Sun’s lifetime (about 3,000 times Earth’s mass) — red line in the bottom panel of the figure at left.

Since a star’s brightness (luminosity) depends very sensitively on its mass, the larger original mass means the Sun would have been a little brighter early on than otherwise. But 1% is not enough to completely cancel out the “faint” part of the young Sun paradox.

However, Spaudling and colleagues point out that estimates of the mass loss during the Sun’s youth are based on limited observations of other young stars and are so are uncertain. Maybe, they suggest, the loss rate was much larger than suspected (the yellow line in the bottom panel of the figure). In this case, the Sun could maintain about the same brightness it has today (yellow line, top panel), side-stepping the paradox altogether.

Oscillations of the Earth’s orbital eccentricity and pole position.

Now, whether this idea holds water remains to be seen, but Spaulding and colleagues suggest we could test their hypothesis by studying sediment deposits on the Earth from billions of years ago.

It turns out that the chemistry and mineralogy of sediments at a given location on Earth depend on contemporaneous climate, and geologists have actually used 1.4-billion-year-old sediments found in China to understand Earth’s ancient tropical meteorology.

Ancient sediments such as these show a clear periodic oscillations, over tens and hundreds of thousands of years, probably linked to variations in Earth’s orbit and pole. Indeed, the Serbian mathematician Milutin Milanković noticed the connection between Earth’s orbit and climate back in the early 20th century, and these oscillations are now called Milanković cycles.

Since the pull of the Sun’s gravity set the pace of this cosmic waltz, in principle, the periodicities exhibited by these sediments should reflect the Sun’s mass. And so Spaulding and colleagues suggest that, with the right deposits, we could spot the slow deceleration of Milanković cycles over billions of years and work out the evolution of the Sun’s mass.

It’s not clear that such an analysis is currently feasible, given the typically large uncertainities involved in age-dating of ancient sediments. But recent work in this direction has used the Chinese sediments to work out details of the Earth and the Moon’s orbit. So astronomers may soon be sifting the dirt to study the stars.

The TESS Spacecraft.

At our journal club last week, we discussed the discovery of a new warm Jupiter from the TESS Mission.

TESS is the successor to the wildly successful Kepler/K2 Mission and is designed to find exoplanets using the same technique as Kepler – looking for their shadows as planets pass in front of their host stars, i.e. the transit technique.

Sadly, the Kepler spacecraft was officially shut down two weeks ag0 because it ran out of fuel, but TESS, launched last March, is off and running, having already discovered about half a dozen new planets.

One of those planets, we discussed in journal club on Friday – a planet orbiting the star HD1397. The gas giant planet is about the same size as Jupiter but half the mass, making it significantly less dense than Saturn.

The planet also has an unusually eccentric or stretched-out orbit that swings very near its host star, passing to within 8 stellar radii from its star at its closest point. By contrast, the Earth is 200 stellar radii away from the Sun.

If this planet had been discovered 20 years ago, it would have completely stumped astrophysicists, and many would likely have doubted its existence. Nowadays, though, such strange planets are practically the norm in exoplanet astronomy.

So with HD1397 b’s discovery, the exoplanet train rumbles on, and we should expect thousands upon thousands more bizzarities from TESS that will, like Kepler’s discoveries, again re-write the planetary rulebook.


At our research group meeting, we also discussed the art of scientific presentations. I’ve pasted the example presentation I gave below.

Kepler-1625 b’s transit as seen by Kepler, with the putative moon’s transit appearing as “ears” on either side. From Teachey et al. (2018a).

Last week, Alex Teachey and Dave Kipping of Columbia University presented impressive evidence for what would be the very first known moon orbiting an exoplanet.

The planet, Kepler-1625 b, is likely more massive than Jupiter but in an Earth-like orbit around an old (9 billion years old) but otherwise Sun-like star. Discovered in 2016 among data from the Kepler Mission, the planet was subjected to an intense analysis by Teachey and Kipping as part of the Hunt for Exomoons with Kepler program. In spite of their persistence, Teachey and Kipping found only hints of a moonshadow accompanying the planet’s distinct transit signal.

Hoping to corroborate their putative moon, they applied for and received 40-hours to observe the system with the Hubble Space Telescope (HST) and look for more lunar transits. In these data, Teachey and Kipping found even more convincing evidence for a moon.

Kepler-1625 b’s and the putative moon’s transits as seen by HST. From Teachey et al. (2018b).

In the figure above, the little dip just to the right of the bigger dip (the planet’s transit) shows every sign of being the shadow of an exomoon circling a star about 7000 lightyears from Earth. Look around at how lucky we are to be alive right now.

Because of the extraordinary magnitude of their claim, Teachey and Kipping peppered their paper with lots of caveats, extending even to their paper’s title (“evidence for an exomoon”, not “we found a large exomoon”).

On top of that, they deployed an flotilla of statistical tests to argue in favor of the exomoon interpretation. One test in particular figures prominently in their analysis – the Bayes factor.

In this context, this ominous-sounding number is a measure of how much more likely one scientific model is over another, given a dataset. For instance, if you found your dog guiltily hiding from a mess in your house (your dataset), you would conclude there is a higher probability your dog made the mess (one scientific model) than a ghost did (another model).

A portrait of someone who may be (but probably isn’t) Thomas Bayes.

The Bayes factor derives from work by the Rev. Thomas Bayes, a minister living in Georgian England, who developed a method to infer the underlying probability for a particular experimental outcome, given results from several actual experiments.

Later, the scientist Simon-Pierre Laplace developed Bayes’ work into a more general theory of inference that he hoped could be used, for example, by juries to judge the guilt or innocence of a defendant.

Nowadays, Bayesian inference shows up everywhere, from analyses of climate change to estimates of the frequency of orange Reese’s pieces. It’s even possible that our brains are natively wired as Bayesian-inference machines.

And so in deciding whether they’d found an exomoon, Teachey and Kipping compared the probability that their Hubble data arose from a model including a lunar transit (as well as gravitational tugs between a planet and moon) to the probability the data showed a lone transiting planet.

Although, as they caution, these probability estimates can’t account for everything, they find the planet-moon model is 400,000 times more probable than the planet-only model.

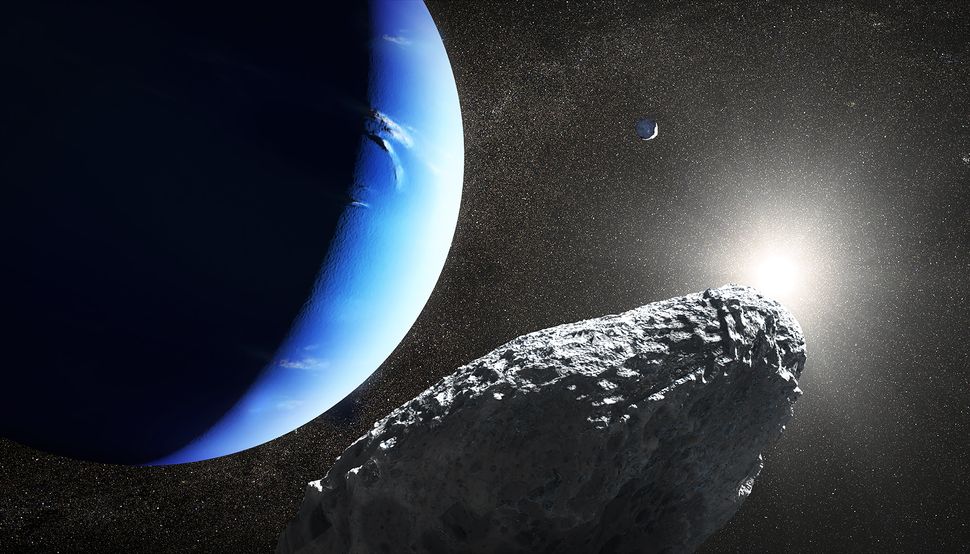
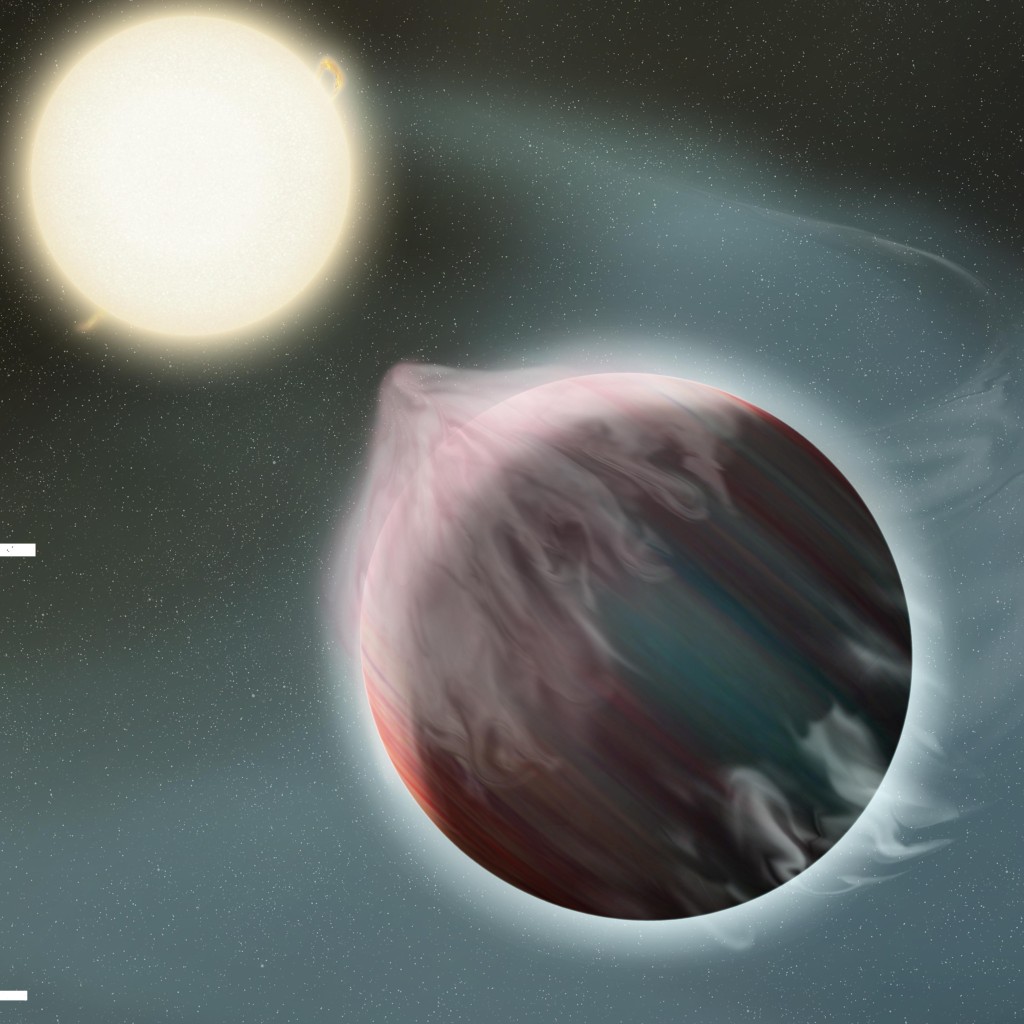
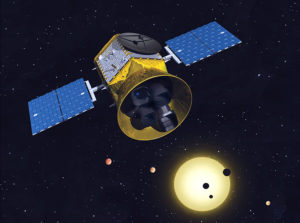
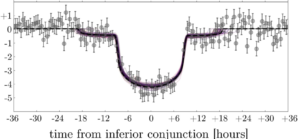
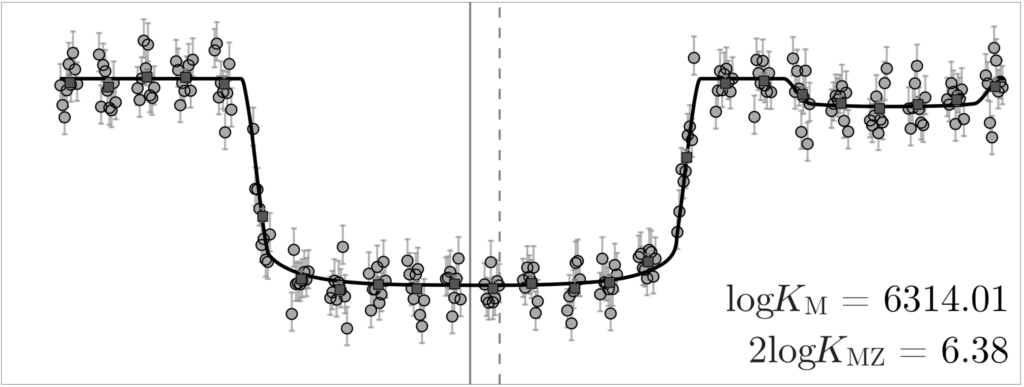
As always, more data are needed to corroborate this fantastic result, but if it holds up, Kepler-1625 would be a system with one super-sized Jupiter-like planet accompanied by a Neptune-sized moon which orbits at a distance of about 300,000 km, not too different from our own moon’s distance.

Very shortly after Teachey and Kipping’s work was published, Kollmeier and Raymond explored the question of whether this monster moon could have its own moon and found that even a moon as large as Ceres could remain stable.

This result immediately prompted a more pressing question: should we call such a body a “sub-moon” or “moonmoon”?


Atacama Compact Array (ACA) on the ALMA high site at an altitude of 5000 metres in northern Chile. From here.

If you haven’t heard about it, the ALMA array, a collection of sixty-six, 12-meter radio dishes situated high in the Atacama desert, is phenomenal. Using the technique of radio interferometry, it’s capable of imaging astronomical objects in infrared (and redder) light with incredibly high resolution.

HL Tauri, as seen by ALMA.

For instance, the image at left was captured by ALMA and shows the debris disk in an infant planetary system orbiting a distant star, HL Tauri. The bull’s-eye pattern is (probably) created by nascent planets still growing by scooping up dust and gas. That disk is physically larger than our whole solar system, but as seen from Earth, 450 light-years away, the disk subtends an angle about 3 micro-degrees across – about the same as the Statue of Liberty as seen from Boise.

As it turns out, Jupiter’s moon Europa, an icy body only a little smaller than our moon, is about as big seen from Earth, making a good target for the ALMA array. Moreover, since the Galileo mission‘s exploration of the Jupiter system, few detailed and high-resolution observations have been made of Europa. On top of that, Europa has a subsurface water ocean that could host alien life.

With all this in mind, Caltech graduate student Samantha Trumbo and Prof. Mike Brown (of Pluto-killing fame) collected ALMA observations of Europa in the fall of 2015. Since ALMA observes in infrared wavelengths, it’s sensitive to heat coming off Europa and essentially acts as a long-distance thermometer, allowing them to map the temperature on Europa’s surface. If certain parts of Europa are warmer than expected, that could indicate sub-surface heating, which might have big implications for any Europan life.

Temperature map of Europa, from Trumbo et al. (2018).

But instead of mysterious hotspots, Trumbo found equally strange cold spots. The color map of Europa at left (red means hot, blue means cold) compares the expected temperatures (“Model”) to what’s actually observed (“Data”), and there are big differences all across Europa.

So what does this mean? Trumbo et al. say it’s not clear but suggest one possibility. The region with the largest temperature discrepancy corresponds to the location of highest water ice abundance, where water from the sub-surface may have been volcanically extruded onto the surface. Since this region was not been imaged at high resolution by Galileo, it’s hard to identify landforms that might corroborate recent eruptions, but such features have been observed elsewhere on Europa.

As always in science, more data would help resolve the puzzle. In any case, NASA is planning a mission for launch in the 2020s that will use an ice-penetrating radar, not too different from ALMA, to probe Europa’s sub-surface ocean and, hopefully resolve the mystery of Europa’s cold spots.