BSU Journal Club

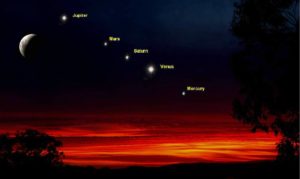
Artist’s impression of planet alignment in 2016. From here.

Anyone who’s done some stargazing has probably noticed that the Sun and the Moon appear along nearly the same arc in the sky. This Sun’s arc, called the ecliptic, corresponds to the plane of the Earth’s orbit. Since all planets in the solar system share nearly the same orbital plane, they likewise hew close to this arc. It turns out that the ecliptic also coincides closely with the Sun’s equator.

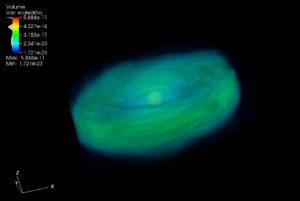
The near alignment of all planetary orbits in the solar system is one of the most important clues to their formation – the solar system originated billions of years ago from a thin disk of gas and dust girding the young Sun’s belly like a hula hoop, an idea going back at least to Immanuel Kant in the 1700s called the Nebular Hypothesis.

Once it was accepted, this idea was so successful at explaining and predicting features of the solar system, astronomers believed all planetary systems in our galaxy would resemble our own – with small, rocky planets close to their stars and large, gassy planets farther away, but all sharing the same orbital plane.

The discoveries of thousands of exoplanets have turned all that on its head – planets around other stars have orbits oriented every which way. For example, the Upsilon Andromeda system has three Jupiter-like planets, all on orbits that are widely misaligned.

Although these topsy-turvy planetary orbits were initially puzzling, astronomers are starting to tease out the explanations for these systems. Planets probably do start out in well-aligned orbits, but, like kids in the backseat on a long car trip, jostling between the planets (due to mutual gravitational tugs) soon upsets this delicate arrangement and upends the orbits. In the case of Upsilon Andromeda, planets may even have been ejected from the system.

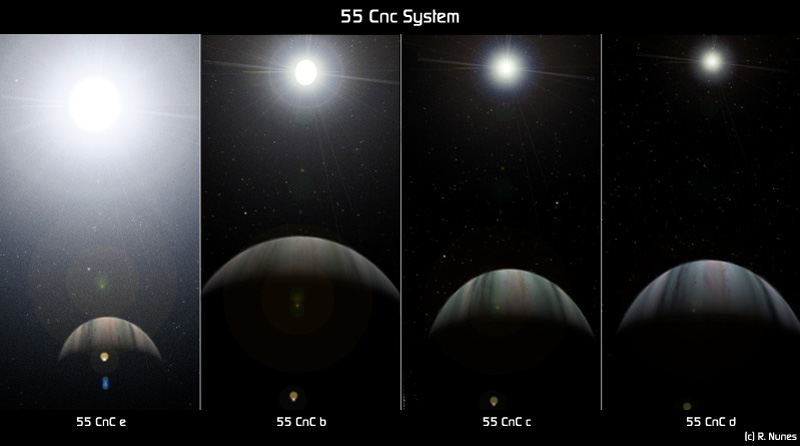
A recent study from Fei Dai and colleagues explored connections between orbital misalignment and the origins of one puzzling class of exoplanet – small, short-period planets. These planets range in size (and probably composition) from Neptune-like to smaller than Earth but inhabit orbits very close to their host stars, some taking only hours to circle the star. Many of these short-period planets also have sibling planets farther out, and the arrangement of these orbits might tell us how the planets got so close to their stars.

As for the Upsilon Andromeda system, the mutual inclination between the orbits, if its big, may point to a history of violence in the system. Such violence may explain how the short-period planets got so close to their stars – they could have started out far away and been thrown by their siblings toward the star. By contrast, a small mutual inclination could mean the system has always been relatively quiescent, and the short-period planets may have gently migrated inward from farther out.

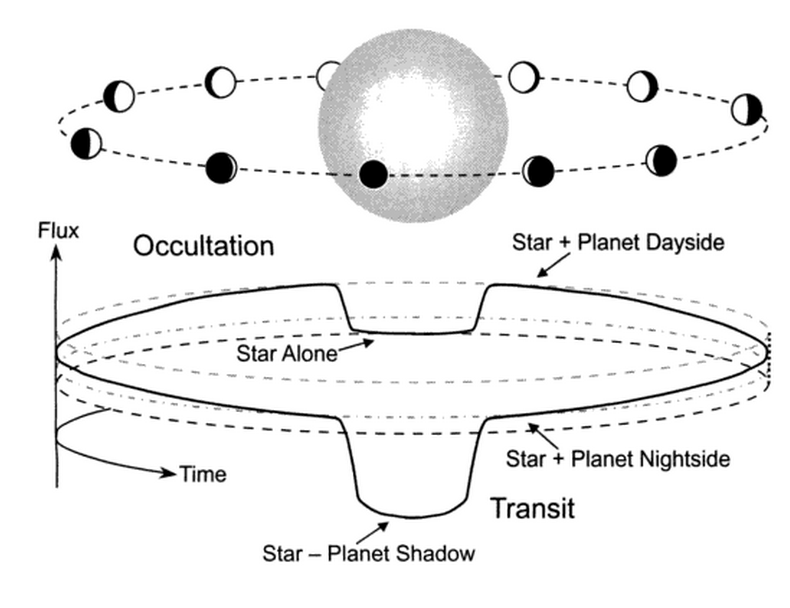
By analyzing the transit light curves of the planets as observed by the Kepler spacecraft, Dai and colleagues found a pattern in the mutual inclinations for these systems. From their paper, the figure below shows that when the distance of the shortest-period planet in a system a/R* is larger, the mutual inclination ΔI between orbits tends to be less widely distributed.

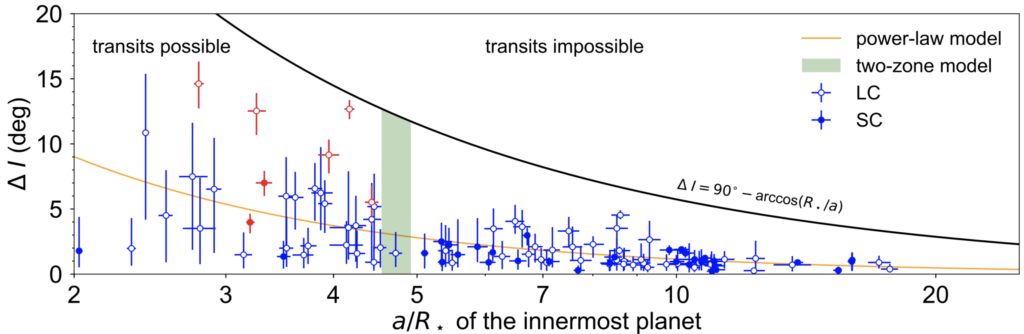
Figure 3 from Dai et al. (2018).

What does this result mean? Since the short-period planets closest to their stars (small a/R*) also seem to have a very wide range of mutual inclinations, maybe they experience the same kind of gravitational jostling that took place in Upsilon Andromeda, while planets farther out, they were moved in more gracefully.

Taking a wider perspective, evidence is mounting that, while planetary systems are common in the galaxy, our own solar system is unique in many ways – there’s really no place like home.

Map of Mars’ south polar ice. The colors show how thick the ice is, and the black rectangle shows the location of the newly discovered sub-surface lake. From Orosei et al. (2018).

As summer winds down and we prepare for the fall semester, I finally found the time to read the recent announcement about finding sub-surface water on Mars using the MARSIS radar onboard Mars Express.

Although evidence for liquid water on Mars has been reported for a long time, these reports are almost always about ancient flows or very modest, salty trickles (and the presence of water often turns out to be illusory). By contrast, if this most recent report holds up to scrutiny, there could be 10 billion liters of liquid water under the martian south pole.

That’s not much on the scale of the Great Lakes (the smallest one, Lake Erie, contains 10,000 times more water), but it’s more than a thousand times the volume of tanks at the Georgia Aquarium, which hosts more than 100,000 aquatic animals. So the martian lake could easily host a microbial zoo (although no direct evidence for that as of now).

As is common in polar regions on Earth, the martian water lies under kilometers of polar ice and is probably so cold it requires some kind of geological anti-freeze to keep from freezing solid (the kinds of mineral salts that can do the job are actually pretty common on Mars). The overburden pressure from all the ice also helps keep the water liquid.

But the fact that the lake sits underneath so much ice raises an obvious question: how did the scientists spot it in the first place? The answer is related to why the recent wildfires in the west, in addition to fouling the air, have given us very lovely sunsets.

Preferential scattering of blue light by the atmosphere.

When it first leaves the surface of the Sun, sunlight is colored white. But as it passes through the atmosphere, the light (which is a wave of electric and magnetic fields, after all) interacts electromagnetically with the atmospheric gas molecules, which themselves contain electric charges.

The closer the wavelength of the light ray is to the sizes of the molecules, the stronger this electromagnetic interaction and the more the ray can be diverted from its straight path.

Since blue light has a wavelength (500 nanometers) closer to the size of the atmospheric molecules than red light (700 nanometers, it is more readily diverted or scattered. At dusk, as the sun sets, its light has to pass through more and more of the Earth’s atmosphere. So more and more blue light is scattered away, leaving behind more red light and making the Sun look red. If you sprinkle in lots of smoke from a wildfire, you can enhance the coloration.

What does all this have to do with martian lakes? The MARSIS instrument used to find the subsurface lake uses very red radar light, with wavelengths tens to hundreds of meters long. Similar to red sunlight, such long wavelengths can easily pass through even solid rock since they’re much larger than the rocky molecules that make up the martian surface.

Reflectivity of radar light from beneath the martian south pole. The bright patch at the bottom marked with “Basal reflection” is from the sub-surface lake. From Orosei et al. (2018).

This explanation simplifies things a lot, but the upshot is that MARSIS could see the lake as a very unusual bright patch underneath all that polar ice.

What’s next? It’s possible that continued data collection and analysis will turn up other subsurface lakes on Mars. If Mars’ south pole is brimming over with these icy lakes, it could be an especially good habitat for martian microbes. So maybe the effort to find martian life should explore using the same ice drilling technology being considered for exploring the oceans of Jupiter’s moon Europa.

A martian dust devil observed by the HiRISE instrument, in orbit around Mars.

Dust devils, whirling columns of fine particulates, have captured imaginations going back at least to the ancient Greeks, but their inner workings continue to confound and surprise scientists. Dust devils are common in arid regions on Earth, and on Mars, where “arid” doesn’t begin to describe the climate, dust devils are ubiquitous.

Especially puzzling, dust devils are better at lifting dust into the air than they ought to be. For example, in lab-simulated vortices, even when the winds are barely above a breeze, small dust grains seem to miraculously levitate and dance. So it seems that some force other than just wind must be important for lofting dust in devils. During our research group meeting today, we discussed a recent study by Gabriele Franzese and colleagues looking at one possibility: electric fields within dust devils.

As dust grains clatter around within the turbulent body of a devil, they can collide over and over again, which can transfer charge between the grains similar to the process that generates static electricity. And, for reasons that aren’t well understood, small grains like to collect negative charge.

Since small grains can be more easily lifted than large ones, small, negatively charged grains end up at higher altitude than large grains in dust devils, resulting in charge separation and a electric field. In the same way static electricity can lift small pieces of paper, these electric fields can draw in more dust grains and help explain the surprising ability of devils to lift shrouds of dust.

From Figure 5 of Franzese et al. (2018), the electric field associated with a dust devil.

For their field study of active dust devils, Franzese and colleagues set up meteorological equipment in the deserts of Morroco and left it there, steadily measuring wind speeds, dust loading, and electric fields. As dust devils skittered past their instruments, they registered as dips and spikes in the data logs. After recovering the instruments and analyzing the data, Franzese and colleagues found more than 500 dust devils had visited their instruments over a three month time-span.


The dust devils displayed a wide variety of shapes, sizes, and, most importantly, electric fields. The picture at left shows the electric field measured for one particularly strong dust devil. In this case, the devil exhibited an enormous electric field, 12,000 V/m. For comparison, such strong electric fields usually seen within storm clouds. Franzese and colleagues show that the strength of field measured for a devil correlates one-to-one with the amount of dust within the devil, so it seems likely electric fields do play some role in the lofting the dust.

Since humidity in the air can wick away static charge, dust devils on arid Mars probably exhibit even stronger electric fields than on Earth, which may help explain why martian devils are so much more common there: even faint whirlwinds manage to lift dust. These same electric fields could also present a danger to human exploration of Mars, though, potentially damaging sensitive electronics. Or at the very least, making a case of the Mondays even worse.

At our research group meeting on Friday, we discussed an interesting paper from Dr. Tom Barclay and colleagues, which explored how many and what kinds of planets we might find with the TESS mission, launched in April this year.

As Barclay et al. argue, trying to estimate the planet yield from an upcoming survey provides several benefits. For instance, knowing how many planets TESS may find can help astronomers figure out how much time to allot for follow-up observations at large observatories. Also, thinking about TESS discoveries is like staying awake on Christmas eve, anticipating all the presents – it’s just plain exciting.

And make no mistake – TESS will be another game-changer. Kepler focused on figuring out how many of each kind of planet there is in our galaxy, but as one of the trade-offs to facilitate this kind of statistical study, most of the systems found by Kepler are much too far away and dim for us to conduct follow-up studies and learn more about the systems.

TESS takes a different tack, focusing on bright, nearby stars for which additional characterization of the planets will be easier. For instance, some of the planets discovered by TESS will be observed by NASA’s next behemoth, the James Webb Space Telescope, which will reveal the planets’ atmospheres in exquisite detail.

Barclay’s paper lets us shake the presents under the TESS tree, hinting at the goodies inside. By modeling a wide variety of planets in orbit around the 3+ million stars that TESS will see, they try to simulate the kinds of observations the mission will collect and figure out which planets TESS can find easily and which ones it will struggle with.

For example, they find TESS may discover nearly 300 planets with radii smaller than twice the Earth’s.  Among these potentially Earth-like planets, roughly ten will orbit in the temperate zone, making them  possible oases for extraterrestrial life.

After reading these results about potentially habitable planets, I was also excited about their prediction that TESS may find 12,000+ giant (i.e. Jupiter-sized) planets. Barclay et al. caution that these objects will be especially hard to distinguish from astrophysical false positives. But these planets may also reveal some of the most interesting astrophysical phenomena, so if there are any clever tricks to extricate these planets, the effort might prove worthwhile.

(top) WASP-12 b’s orbit. (bottom) The Roche lobe around WASP-12 b.

WASP-12 b is a planet in crisis.

One of the hottest of the hot Jupiters, the gas giant circles its Sun-like host star in a blistering 1.09-day orbit, giving its an atmosphere hot enough to vaporize rubies.

In fact, WASP-12 b is so close to its star that it very nearly fills its Roche lobe, the teardrop-shaped region inside of which material is bound to the planet. Anything on the other side of the Roche lobe falls into the gravitational clutches of the host star and can either tumble into the star or leave the system altogether.

Because WASP-12 b’s atmosphere is so hot, it is very puffy and extended, and a study from several years ago pointed out that some of the atmosphere can probably spill over the Roche lobe and escape the planet. Indeed, several groups have seen indications of outflow from WASP-12 b, meaning the planet is falling apart in front of our eyes.

Knowing what happens to the gas after escaping the planet is important for understanding the fate of the planet. If the gas goes into orbit around the star, forming an accretion disk, the planet might have billions of years before it’s destroyed. On the other hand, if the gas quickly escapes from the system or is otherwise prevented from forming a disk, the star’s gravity could rip the planet apart in an astronomical blink-of-an-eye.

A recent study from Alex Debrecht and colleagues from University of Rochester Physics and Astronomy explored what happens to gas escaping WASP-12 b. For their study, they constructed hydrodynamic models using the AstroBEAR code and found that a substantial torus of hot gas could build up around the host star in about a decade, potentially enough gas to explain the observations showing some kind of spectral absorption from the system. Such tori may commonly form in systems with ultra-hot Jupiters, so this study is probably relevant to lots of exotic exoplanets.

Three-dimensional simulation of gas torus in the WASP-12 system.

As interesting as these results are, though, they leave some important issues unaddressed. For instance, Debrecht and colleagues didn’t seem to include any accretion onto the host star, which might happen proceed at a fairly high rate. And the balance between outflow from the planet and accretion onto the star will go a long way to determining the amount of material in the accretion disk.

And knowing the amount of material in the disk on orbits interior and exterior to the planet’s orbit is critical for understanding the fate of WASP-12 b and other similar ultra-hot Jupiters. The accretion disk can gravitationally tug on the planet – material interior can push the planet out, while material exterior can push the planet in, potentially dooming the planet to rapid disruption.

But as is true for even the most seminal scientific work, more research is needed.

There are currently only about half a dozen Earth-sized planets orbiting stars that you can see without a telescope or binoculars, called “naked eye stars“. Among this select class, the 55 Cancri system stands out as unique – located in the constellation Cancer, 55 Cancri, a star very similar to our Sun, hosts five planets, ranging from Earth-sized to bigger than Jupiter.

Artist’s conception of the views from four of the 55 Cancri planets. From https://en.wikipedia.org/wiki/File:55cnc.jpg.

The innermost planet, 55 Cancri e, is the one most similar to our own planet, with a mass eight times Earth’s and radius twice Earth’s.

In some big ways, though, 55 e is a far cry from Earth – it’s almost a hundred times closer to its star than we are to ours, meaning its year is only about 18 hours long. Recent observations from the Hubble Space Telescope also suggest it has a hydrogen and helium atmosphere with a pressure comparable to Earth’s. But one thing 55 e might have in common with Earth: active volcanoes.

A recent study from Patrick Tamburo of Boston University analyzed infrared observations of the 55 Cancri system collected by the Spitzer Space Telescope and found evidence for some sort of dramatic change on 55 e.

The observations were collected just as 55 e plunged behind the star as seen from the Earth. Such a configuration is referred to as a planetary eclipse or occulation.

A comparison between transits and secondary eclipses (also sometimes called occultations). In a planetary transit, the planet crosses in front of the star (see lower dip) blocking a fraction of the star’s brightness. In a secondary eclipse, the planet crosses behind the star, blocking the planet’s brightness (see dip in the middle). The latter dip in brightness is fainter due to the faintness of the planet. Image credit: Josh Winn.

During an eclipse, the planet’s host star blocks out any light coming from the planet, which can produce a tiny dip in the total amount of light coming from the system.

The depth of that eclipse dip tells us how bright the dayside of the planet is – a very bright dayside would produce a big dip, indicating a hot and bright atmosphere, while a dark dayside would produce no dip, meaning a very cool atmosphere. But what if the dip is shallow during some eclipses and deep during others?

That’s exactly what Tamburo and colleagues found. In 2012, the planet exhibited eclipses with little to no depth. But when Spitzer revisited the system in 2013, it found whopping eclipses, with the planet emitting about 0.02% of the star’s light. This change corresponds to an increase in the planet’s apparent temperature of more than 1,000 degrees Kelvin (about 2,000 F).

What could cause such a dramatic change? As in the original study of these data, Tamburo and colleagues explore the possibility that an enormous volcanic eruption on 55 e could have injected dust high into the atmosphere (about 100 km up) in 2012, shrouding the lower and hotter atmosphere and surface. By 2013, the dust cloud could have settled out, raising the planet’s apparent temperature.

How plausible is this idea? Surprisingly, plausible actually. Previous studies of 55 e have shown that interactions between the planet and its sibling planets could induce enormous amounts of tidal heating within 55 e, similar to Jupiter’s moon Io, and potentially powering tremendous geophysical activity.

Eruption column rising over Redoubt Volcano, Alaska.

Large terrestrial eruptive plumes have reached 40 km height in Earth’s atmosphere, so perhaps such altitudes are not unreasonable on 55 e. However, 55 e has a surface gravity more than twice Earth’s and its atmospheric temperatures are likely much higher than Earth’s, both of which would inhibit ascent of a volcanic plume. So it’s not totally clear this exciting idea could pan out in detail.

In any case, these new results may represent the emergence a new field of study, observational exoplanetary volcanology, and maybe scientists a few generations from now will be trying to predict volcanic activity on Kilauea and Cancer.

Nominal trajectory of ‘Oumuamua. From https://en.wikipedia.org/wiki/File:C2017U1.gif.

A month ago, astronomers found, for the first time, an asteroid that definitely originated from outside our solar system.

The object, 1I/ʻOumuamua, came screaming into our solar system at 60,000 mph, took a sharp turn around the Sun, and passed within 10 million miles of Earth on Oct 18 before beginning its long journey out of our solar system and back into interstellar space.

Given its highly elongated and inclined orbit, ʻOumuamua was initially classified as a comet, but follow-up observations showed no sign of a coma, and so it was re-classified as an asteroid. Its discovery has prompted a flurry of short but exciting astronomical studies, and in our research group meeting this week, we discussed two: Ye et al. (2017) and Laughlin & Batygin (2017).

In their study, Ye and colleagues describe their observations of ʻOumuamua’s brightness and color. Their color observations indicated that ʻOumuamua is slightly but not very red, unlike many icy bodies in our Kuiper Belt. This result suggests it either formed close to its original central star (and never had much ice) or spent time near enough to its original parent star to have baked off any ice.

They also estimated that ʻOumuamua passed very near Earth’s orbit, close enough that, if any material were ejected from its surface, it may produce a meteor shower in a few hundred years.

In their study, Laughlin and Batygin took a more theoretical tact and explored possible implications of ʻOumuamua’s for the existence of planets like the putative Planet Nine.

ʻOumuamua almost definitely originated in a distant solar system and was ejected by a gravitational interaction with a planet in that system, and Laughlin and Batygin point out that most of the known exoplanet population would probably not be very good at ejecting objects like ʻOumuamua: these planets are so small and/or close to their host stars that they cannot easily liberate asteroids like ʻOumuamua from the host stars’ gravitational clutches.

But, Laughlin and Batygin suggest, if there is a sizable population of largish (several Earth masses) planets several times farther from their host stars than Earth is from the Sun, then gravitational ejections of asteroids might occur frequently enough to explain objects like ʻOumuamua.

Granted, they’re dealing with a sample size of one, but several all-sky surveys, like LSST and TESS, will arrive on the scene any day now. And we may very soon find other interstellar interlopers like ʻOumuamua. The galaxy is probably full of them.

Figure 1 (left) and 2 (right) from Anglada et al. (2017). The right figure shows a zoomed-in version of the left figure. The rainbow blob at the center of the left figure is Proxima Centauri’s debris disk, and the white ellipse shows the possible outer disk. The greenish blob just to the left of center in the right figure is the mysterious source, possibly a ringed planet.

In case you didn’t hear, late last year, astronomers confirmed a planet around our nearest stellar neighbor, Proxima Centauri, a red-dwarf star just four light years from Earth. The planet is probably about 30% more massive than Earth, probably making its composition Earth-like, and it’s in the habitable zone of its star, at a distance of about 0.05 astronomical units (AU) – all of which make it an exciting prospect for follow-up studies.

And just last week, Guillem Anglada and colleagues announced the further discovery of a debris disk around the star. The left figure up top shows the image, in radio wavelengths, of emission from the disk – the disk appears as the rainbow blob near the center, and the location of the host star Proxima is marked with a black cross.

The disk’s appears to orbit between 1 and 4 AU from its host star, which would put it between the Earth and Jupiter if it orbited in our solar system. However, since the red-dwarf star is so much smaller and cooler than our Sun, those orbital distances correspond to temperatures of only a few tens of degrees, making Proxima’s disk more akin to our Kuiper belt than our main asteroid belt.

The radio light we see from the disk is mostly due to thermal emission from dust. Using the above temperature estimate (and some other reasonable assumptions), Anglada and colleagues estimate (with large uncertainties) Proxima’s disk has about one thirtieth the mass of Ceres in dust and a lunar mass in larger bodies – almost as much mass as our Kuiper belt. There’s also marginal evidence in the data for a larger and cooler disk as well, perhaps 30 times farther from the star than the inner disk, and for something perhaps even more interesting.

In the right figure above, see the greenish blob just below and to left of the rainbow blob? That (admittedly weak) signal could be emission from a ring system orbiting a roughly Saturn-mass planet about 1.6 AU distant from the star. The authors point out that there’s a small but non-zero chance that it’s actually just a background galaxy that photobombed their observations, a possibility that can be easily tested by looking at Proxima again in a few months. But if it turns out to be a ringed planet, it would be the first exo-ring system directly imaged (other systems show possible signs of rings).

That would make Proxima an even more unusual planetary system since small stars tend to have small planets, and I’m only familiar with one other red dwarf star that hosts a big planet – NGTS-1 b, a red-dwarf hosting a hot Jupiter. But if there’s one thing that exoplanet astronomy has taught us in the last few decades, it’s to expect the unexpected.

The diagram below shows the structure of the Proxima Centauri system suggested by Anglada and colleagues.

Figure 4 from Anglada et al. (2017), showing the suggested structure of the Proxima Centauri planet-disk system.

At the research group meeting today, we discussed the recent reports of additional fast radio bursts (FRBs) originating from the mysterious source FRB 121102 by the Breakthrough Listen search for alien communications.

It has been proposed that FRBs are some kind of alien signal. In fact, Lingam & Loeb at Harvard earlier this year suggested FRBs might be beams of light used by aliens to accelerate alien ships into space. Probably not, but a very cool suggestion.

One of the neatest responses to this recent detection was the conversion of the radio signals into audio by redditor u/Arzu1982, which I’ve linked to below. Not sure that the audio provides any insight into the origin of the FRBs, but they are neat to listen to.