It’s been miserably cold in Boise, and we’ve had record snowfall during the last few weeks.
Sunday, however, it was relatively warm — warm enough, in fact, that the snow that was slated to fall fell as sleet instead.
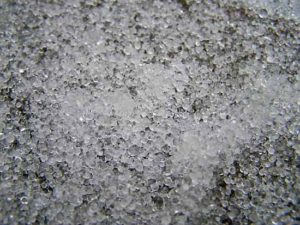
So I took my daughter over to a friend’s house for a playdate, and as we walked over, we heard the beautiful sound of the tiny icy pebbles clattering to the ground. The sound was so distinctive and regular that I whipped out my phone to record it.
When I got home later, it seemed like there must be something interesting I could do with the recording, and the first thing that struck me was to analyze the frequency of the clattering sound. In other words, how often did I hear a sleet pellet strike the ground?
To begin, I imported the m4a file from my iphone and then convert it via command-line into a wav file (since I planned to use python and it was easier to find ways to manipulate wav than m4a files):
ffmpeg -i Sleet_Falling.m4a Sleet_Falling.wav
Then I fired up ipython notebook and imported and plotted the wav file:
[codesyntax lang=”python”]
%matplotlib inline

import numpy as np
import wave
import matplotlib.pyplot as plt

from scipy.io import wavfile
# Load the data and calculate the time of each sample
samplerate, data = wavfile.read('Sleet_Falling.wav')
times = np.arange(len(data))/float(samplerate)

# Make the plot
# You can tweak the figsize (width, height) in inches
fig = plt.figure(figsize=(6, 4))
ax = fig.add_subplot(111)
ax.plot(times, data, lw=0.5)
ax.set_xlim([0,10])
ax.set_ylim([-2000,2000])
ax.set_xlabel('time (s)')

fig.savefig('Sleet_Falling.png', dpi=500
[/codesyntax]
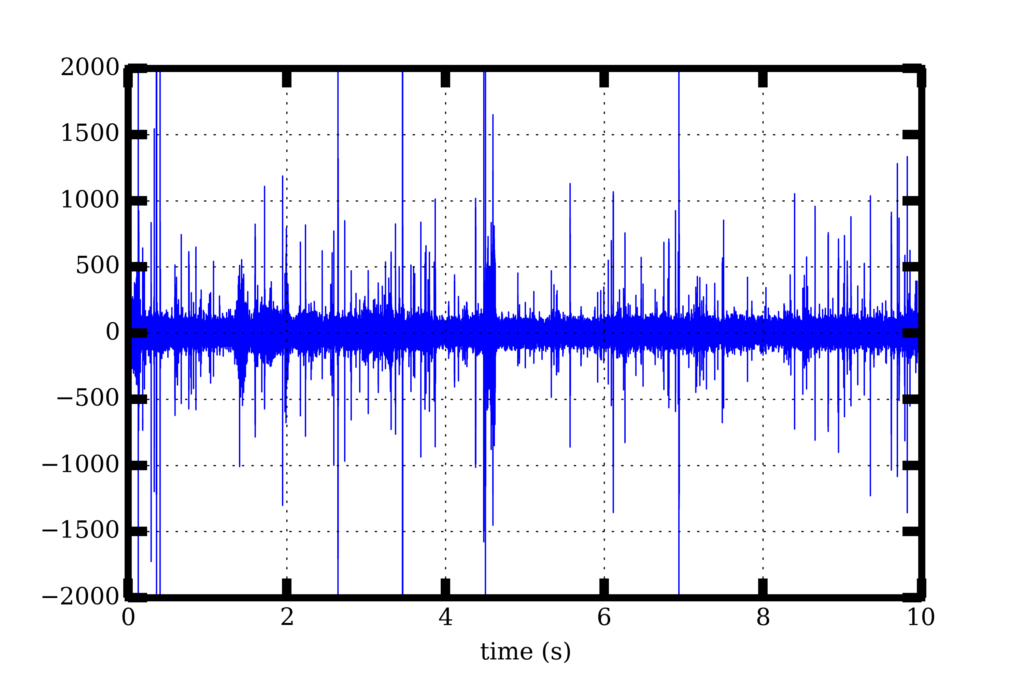
The distinctive rapid crackling is apparent in the waveform.
Next, I calculated a Fourier transform of the signal:
[codesyntax lang=”python”]
from numpy.fft import rfft

ft = np.fft.rfft(data)
n = data.size
timestep = 1./samplerate
freq = np.fft.rfftfreq(n, d=timestep)
period = 1./freq

fig = plt.figure(figsize=(6, 6))
ax = fig.add_subplot(111)
ax.semilogx(period, abs(ft), lw=0.5)

mx_arg = abs(ft).argmax()
print(period[mx_arg])

fig.savefig('Sleet_Falling_fft.png', dpi=500)
[/codesyntax]
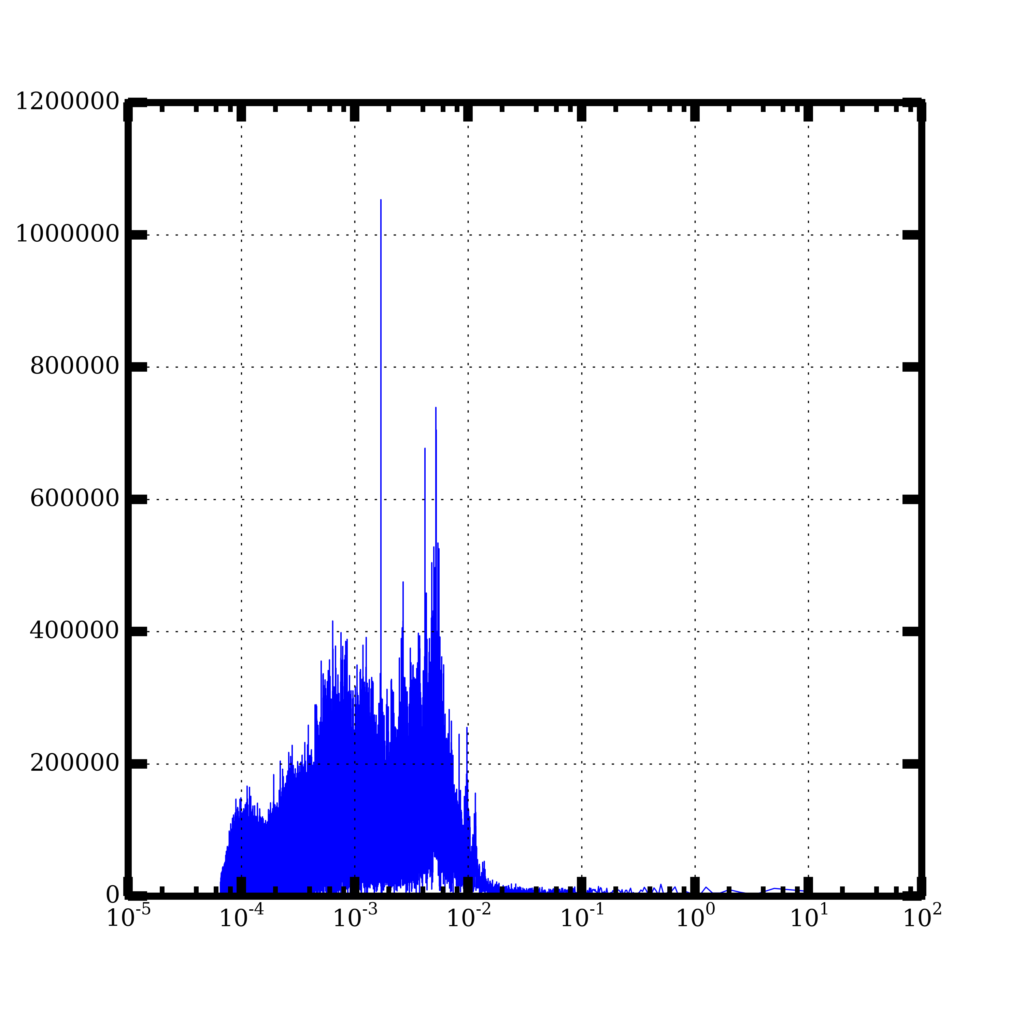
which shows a distinct peak at about 1 millisecond.
Assuming the sleet I saw is about 5 mm in radius, I estimate a terminal velocity of about 5 m/s. If I imagine (unrealistically) that the sleet particles are falling in a single column, with one directly above another and traveling at 5 m/s, then one striking the ground every millisecond means the sleet balls are basically packed end to end, as tightly as they can be [1 ms = (5 mm)/(5 m/s)]. Of course, if the pellets were spread out and striking the ground at random places, they could be way more spread out and not as many would have to fall at a time in order to make the sound I heard.
Turns out I’m not the first person to try estimating the precipitation rate using sound. NASA deploys microphones in the ocean to record the distinctive sound of raindrops.
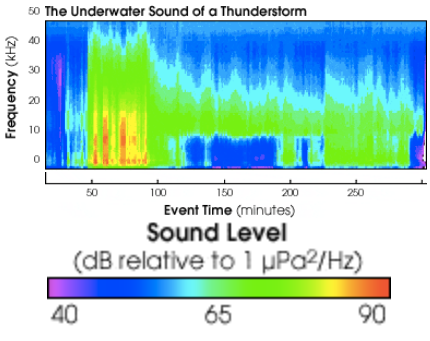
From http://earthobservatory.nasa.gov/Features/Rain/rain_2.php.
In fact, different size raindrops make different sounds because some sizes of drops generate bubbles and others do not, and so scientists can actually estimate the sizes of raindrops by just looking at the distribution of frequencies.
Unfortunately, I can’t make the same kinds of measurements using my iPhone because I haven’t calibrated the microphone using a sound of known amplitude. Maybe something for the future.
