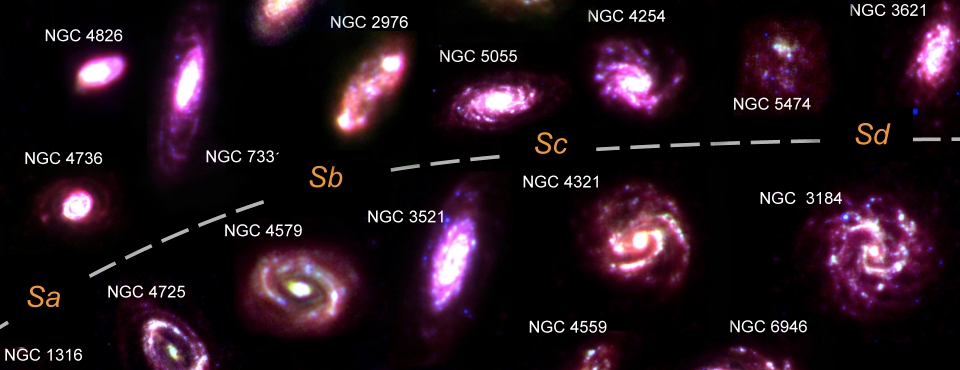
The images were created using observations from the Spitzer SINGS survey and the Herschel KINGFISH survey. Rather than stars, the images show dust between the stars, which is created by dying stars and forms some of the material from which stars are formed. The colour images are made by combining three different wavelengths. From http://www.astro.umd.edu/~rhc/bigbang/boxed/research_blog.html.

The images of many different kinds of galaxies were created using observations from the Spitzer SINGS survey and the Herschel KINGFISH survey. From http://www.astro.umd.edu/~rhc/bigbang/boxed/research_blog.html.

For today’s astronomy seminar, we had Rodrigo Herrera from University of Maryland Astronomy. Rodrigo spoke about using far infrared observations from the Herschel instrument to study star formation in nearby galaxies.

Rodrigo talked about using emission at 158 microns, created by ionized carbon atoms (CII), to probe the rates of star formation. The hottest and youngest stars in a stellar nursery, O and B stars, are thought to heat dust grains, charging them slightly. The resulting excess electrons then escape into the gas surrounding the stellar nursery, heating it. Some of that gas is ionized carbon, which cools by emitting photons at a very specific wavelength, 158 microns.

By observing how much 158-micron emission is coming from a galaxy (and applying some important corrections to account for the variation in the physical environments in each star-forming region), Rodrigo showed that astronomers could pretty accurately estimate the rate at which stars are forming throughout that galaxy.

Understanding the star formation rate is important for may aspects of astronomy, but in particular, the star formation rate is a key parameter for the Drake equation, which estimates the number of intelligent and communicating civilizations in the universe. Such civilizations probably grow up orbiting a star similar to the Sun, so knowing how often such stars form goes a long way to telling us how many extraterrestrial civilizations might be out there.
 

Interesting seminar today from Prof. Richard O’Connell of Harvard Geophysics. Prof. O’Connell discussed the interplay between the thermal evolution of the Earth’s interior and plate tectonics.

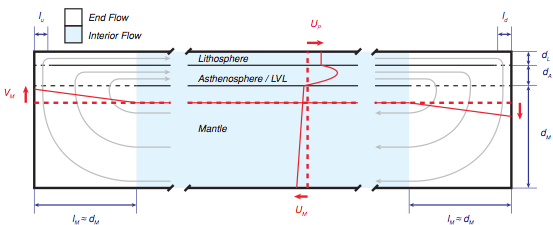
Flow structure of the convection cell in a model of the Earth's interior. Figure 3 from Crowley & O'Connell (2012) -- http://adsabs.harvard.edu/abs/2012GeoJI.188...61C.

Flow structure of the convection cell in a model of the Earth’s interior. Figure 3 from Crowley & O’Connell (2012) — http://adsabs.harvard.edu/abs/2012GeoJI.188…61C.

New models from Prof. O’Connell and his student John Crowley suggest that the Earth may have undergone different stages of tectonic evolution, with the tectonic plates moving quickly at some times in the Earth’s history but much more slowly at others.

The evolution between different geophysical modes may help explain a longstanding puzzle in Earth science: the amount of heat coming out of the Earth is much greater than expected and has been thought to require much more heating from radioactive isotopes than geochemical analyses allow.

If, instead, O’Connell and Crowley are right, then this large heat flow is really just a symptom of Earth’s geophysical fickleness: sometimes lots of heat comes out, other times less.

We had a great talk at DTM today from Dr. Mark Wieczorek, a geophysicist from the Institut de Physique du Globe de Paris.

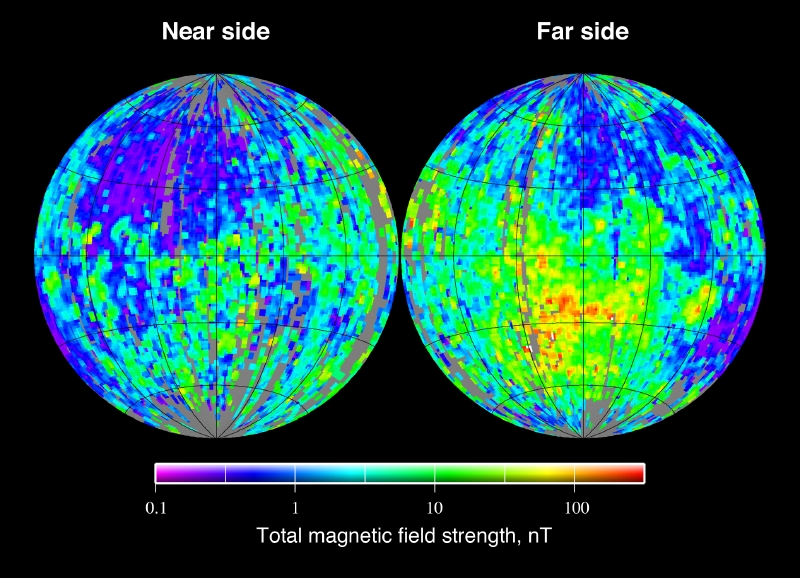
Total magnetic field strength at the surface of the Moon as derived from the Lunar Prospector electron reflectometer experiment. From http://en.wikipedia.org/wiki/File:Moon_ER_magnetic_field.jpg.

Total magnetic field strength at the surface of the Moon as derived from the Lunar Prospector electron reflectometer experiment. From http://en.wikipedia.org/wiki/File:Moon_ER_magnetic_field.jpg.

He talked about the geophysical history of the Moon as inferred from remnant magnetic fields in lunar rocks.

Currently, the Moon does not have a large-scale magnetic field, as the Earth does, but there are smaller-scale magnetic anomalies (see figure at right). These remnant magnetic signatures probably indicate that long ago (about 3-4 billion years ag0) that Moon DID have a magnetic field.

So why did the Moon have a magnetic field long ago and why doesn’t it anymore? One exotic idea Dr. Wieczorek talked about was the idea that large asteroidal or cometary impacts could disrupt the rotation of the Moon’s mantle.

As a result, the mantle and core would rotate at different rates in different directions, which could stir up and heat fluid in the Moon’s interior. This heating could drive internal convection and produce a magnetic field, similar to the way the magnetic field in the Earth is generated.

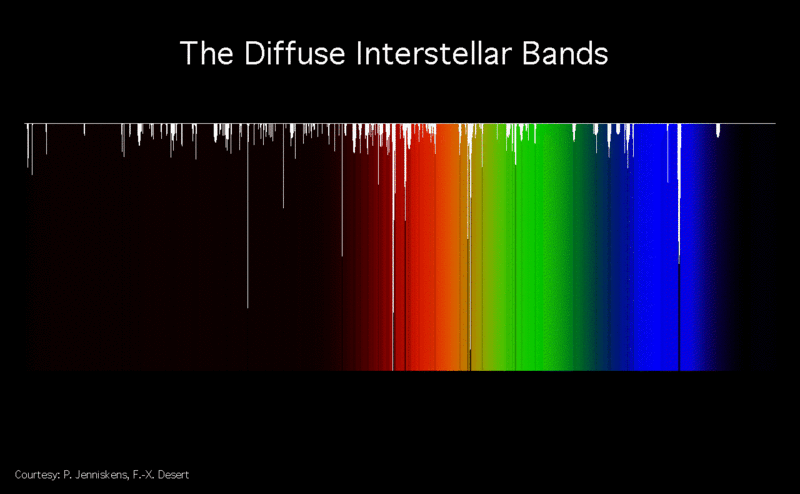
Relative strengths of known diffuse interstellar bands. From http://en.wikipedia.org/wiki/File:Diffuse_Interstellar_Bands.gif.

Relative strengths of known diffuse interstellar bands. From http://en.wikipedia.org/wiki/File:Diffuse_Interstellar_Bands.gif.

We had a great talk today from Dr. Gail Zasowski of Johns Hopkins University Astronomy. She talked about mysterious spectral features called diffuse interstellar bands (or DIBS).

Illustrated at left, DIBs are spectral absorption features that pop up when astronomers point their telescopes in almost any direction in the sky. The DIBs are probably created by some type of molecule (or molecules) that abounds throughout our galaxy, but astronomers and astrochemists haven’t figure out what it is yet, even after decades of work.

Dr. Zasowski described how the DIBs could be identified in the vast collection of spectra from the APOGEE project and then used to map structure in the Milky Way. It goes to show that, just because we don’t know what exactly we’re looking at, it doesn’t mean astronomers can’t use the information to learn about the universe.

NASA's Nuclear Spectroscopic Telescope Array, or NuSTAR, has captured these first, focused views of the supermassive black hole at the heart of our galaxy in high-energy X-ray light. Taken from wikipedia.

NASA’s Nuclear Spectroscopic Telescope Array, or NuSTAR, has captured these first, focused views of the supermassive black hole at the heart of our galaxy in high-energy X-ray light. Taken from wikipedia.

Dr. Daniel Wik visited DTM this morning to give a talk about NASA’s NuSTAR mission, an X-ray telescope in low-Earth orbit designed to study some of the most exotic and energetic phenomena in the universe.

For example, the image at left shows observations taken by NuSTAR of the center of our galaxy. In recent years, astronomers have learned that a supermassive blackhole looms at the center of our galaxy, gobbling up gas.

The images at left show a flare bursting from the galactic center, made of gas heated to 180 million degrees Fahrenheit (100 million degrees Celsius) as the black hole sucked material down into its deep, dark center.

This image of the brown dwarf binary CFBDSIR 1458+10 was obtained using the Laser Guide Star (LGS) Adaptive Optics system on the Keck II Telescope in Hawaii.

This image of the brown dwarf binary CFBDSIR 1458+10 was obtained using the Laser Guide Star (LGS) Adaptive Optics system on the Keck II Telescope in Hawaii. Taken from wikipedia.org.

Good DTM seminar today by Prof. Chris Tinney, presenting a long and fascinating list of results from exoplanetary astronomy.

Among many projects his group is working on at the University of New South Wales, they are observing potential planet-hosting stars for the radial velocity signals of gas giant planets in orbits with long periods, comparable to Jupiter’s period of 12 years. Such planets require long observational baselines to find because you must observe the planet-hosting star for at least one orbital period, 12 years, to conclusively say that you’ve found such a planet. As a result, there aren’t too many long-period exoplanets known.

His group is also looking for brown dwarfs, exotic objects that aren’t quite stars but aren’t quite planets either. Brown dwarfs have masses large enough (probably greater than 13 times Jupiter’s mass) that they can fuse deuterium in their interiors — unlike planets — but small enough that they don’t fuse the lighter isotope, hydrogen — unlike stars.

Today we had a great DTM seminar by Rachel Osten from the Space Telescope Science Institute (STScI). She talked about stellar activity and coronal mass ejections (CMEs).

A coronal mass ejection in time-lapse imagery obtained with the LASCO instrument. The Sun (center) is obscured by the coronagraph's mask.

A coronal mass ejection in time-lapse imagery obtained with the LASCO instrument. The Sun (center) is obscured by the coronagraph’s mask.

Osten pointed out that these huge eruptions from stars are important for several reasons. For example, the energy and frequency of CMEs depend on several properties of stars, including their age, rotation rates, and magnetic fields. In general, as stars age, their rotation rates drop, usually reducing the strength of their magnetic fields and the amount of CME activity. And so learning about CMEs can tell us about stellar evolution.

When a star fires off a CME, it typically flares or brightens a bit (see figure at right), and since we can’t see stars other than our Sun up close, we can use the temporary brightening of those stars to study their flare activity. Osten talked about one of her projects to use data from the Hubble Space Telescope to look for flare activity for many stars near the constellation Sagittarius.

That project had a surprising result: many stars that were thought to be older than the Sun actually showed MORE flare activity than they should have. This result might mean these stars actually have previously unknown binary companions that kept the stars spinning quickly and thereby keeping their flare activity up.

Stellar flares may also be important for planetary habitability. For example, a big stellar flare can actually disrupt the atmosphere of an Earth-like planet, perhaps even removing all of the life-protecting ozone.


Comparison of Venus' and Earth's topography. For Venus, orange represents the topographic highs, blue the lows. For the Earth, red represents the highs and blue the lows.

Comparison of Venus’ and Earth’s topography. For Venus, orange represents the topographic highs, blue the lows. For the Earth, red represents the highs and blue the lows.

Today I saw an interesting talk about Venusian geophysics by Dr. Steve Mackwell.

Dr. Mackwell talked about how mountains, volcanoes, craters, and fractures in Venus’ surface allow scientists to infer the tectonic history of Venus.

For example, unlike the Moon, there aren’t that many craters on the surface of Venus, which should have accumulated with time as more and more asteroids and comets struck the surface. This lack of craters (along with widespread, large-scale volcanic features) suggest that Venus underwent a tremendous volcanic upheaval about a half billion years ago, during which global volcanic eruptions almost completely re-surfaced the planet.

Dr. Mackwell also discussed how his lab experiments in rock mechanics (in which he squeezes and heats rocks to determine their physical properties) have contributed to our understanding of Venus’ history.

For example, the flow of heat from Venus’ interior drives its geophysical activity and plays a key role in determining the strength of the rocks underlying the surface topography. Understanding the relationship between internal heat flow and rock strength, however, requires lab experiments such as Dr. Mackwell’s.

This is an enlarged image of the region around the Kleinman-Low nebula in the Orion cloud located 1500 light years away. This image is taken in light at 2.12 micron at the Subaru telescope, which is emitted by warm molecular hydrogen gas with an absolute temperature of 2000 K.

This is an enlarged image of the region around the Kleinman-Low nebula in the Orion cloud located 1500 light years away, where a massive star may be in the process of forming. This image was taken in light at 2.12 micron at the Subaru telescope, which is emitted by warm molecular hydrogen gas with an absolute temperature of 2000 K.

I saw an interesting colloquium talk today at the National Radio Astronomy Observatory, given by Prof. Jonathan Tan about formation of massive stars.

Many details about the formation process for massive stars remain unclear, and Prof. Tan described that the stars may either form through the merger of many small, low-mass stellar cores or by direct accretion of massive quantities of gas.

And big questions about these processes remain. For example, what spurs the initial collapse of a gas cloud into star? How exactly is the mass accreted, and what forces dominate that accretion? How long do all these processes take?

Prof. Tan described observations of clumps of gas and dust in the galaxy, including observations from the world’s largest radio telescope, the ALMA array, and how these observations may provide constraints on the star formation processes.


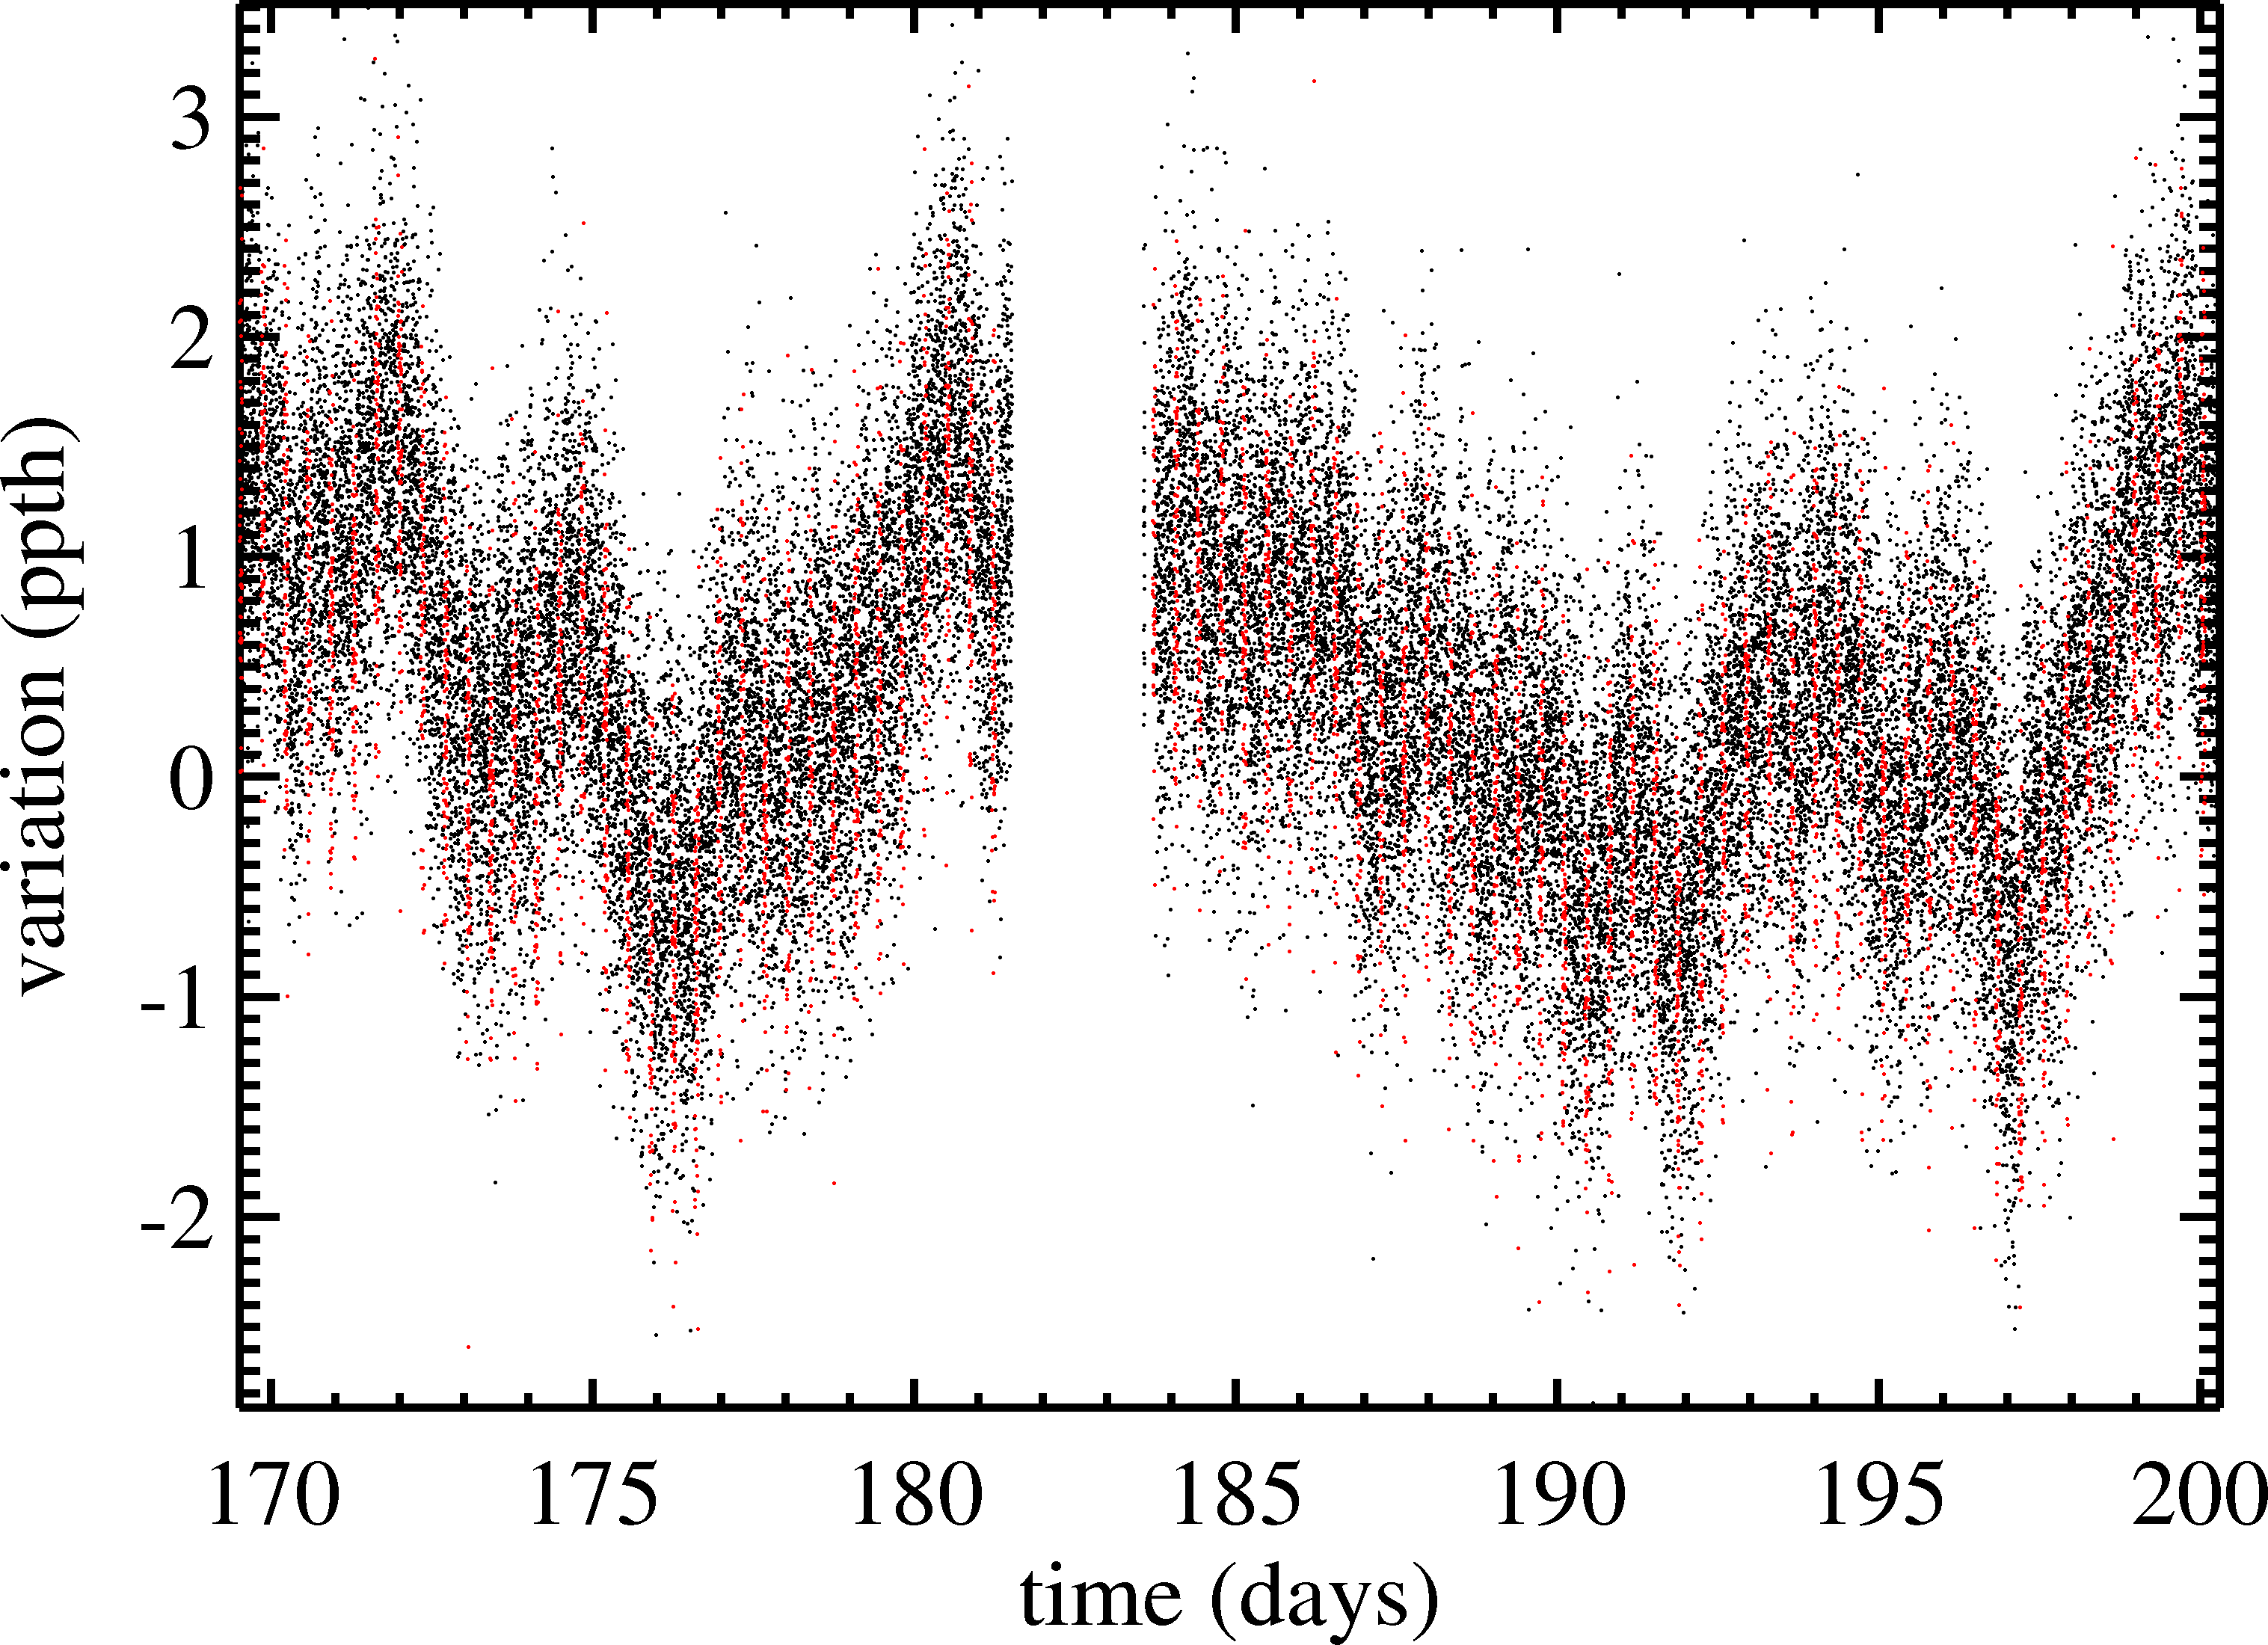
Synthetic data for the new pointing capabilities of Kepler. The red points show when the planet is transiting.

Synthetic data for the new pointing capabilities of Kepler, showing the expected brightness variations for a planet hosting a star that transits (i.e., the planet passes in front of the star, blocking out some of the light). The red points show when the planet is transiting.

Recently, the Kepler mission announced that two reaction wheels on the spacecraft have failed, and so the telescope won’t be able to point as accurately as before. As a result, data from the telescope will suffer from large instrumental variations (see figure at right), and so it will be difficult to detect Earth-like planets. However, the telescope may be able to detect other kinds of planets and study other astronomical phenomena.

In response to a request from Kepler for new ideas of what to do with the telescope, I wrote about an idea to search for very short-period (less than 1 day) planets. A re-purposed Kepler mission could continue the search for nearly Earth-sized planets in very short-period orbits. Our recent work revealed more than a dozen such planetary candidates, and a more complete and focused survey is likely to reveal more.