Dr. Richard Gaschnig of UMD Geology gave an interesting talk today about inferring the composition of the Earth’s ancient crust from glacial sediment deposits.

Banded iron formation with tiger-eye, Mount Brockman, Australia. From http://www.pbase.com/image/94666060.

Banded iron formation with tiger-eye, Mount Brockman, Australia. From http://www.pbase.com/image/94666060.

Gaschnig described detailed analyses of transition metals (TMs) to understand how the composition of minerals at the Earth’s surface might have changed over billions of years. These elements can be especially sensitive to their chemical environment, and so the TM content of ancient rocks tells us what things were like chemically as the rocks were formed.

A particularly interesting result emerged from Gaschnig’s work: the TM signatures he’s measured for some ancient rocks show evidence for initially low levels of oxygen immediately following the beginning of the Great Oxygenation Event (GOE), the phase in Earth’s history when ancient cyanobacteria became so prominent that they produced vast quantities of oxygen.

All this oxygen dramatically affected the chemical environment on the Earth, and its relatively sudden appearance in the atmosphere is reflected the mineralogy of some rocks, such as the banded iron formations shown at the right. Of course, without oxygen, most life as we know it would be impossible, but when it first appeared, the oxygen probably devastated the biosphere.

Some of Gaschnig’s rock samples dated to before and after the GOE show chemical changes in the TM content that may be consistent with the presence of oxygen but only at low levels (at least immediately after the GOE began) and so can be used to fill in some of the missing details about this dramatic chapter in Earth’s history.

Figures from Kreidberg et al. (2014). The top panel is an image of the Hubble Telescope CCD as it collected photons of many colors passing through GJ 1214 b's atmosphere. The bottom panel shows the infrared spectra that results from analysis of that image, showing no molecular features.

Figures from Kreidberg et al. (2014). The top panel is an image of the Hubble Telescope CCD as it collected photons of many colors passing through GJ 1214 b’s atmosphere. The bottom panel shows the infrared spectra that results from analysis of that image, showing no molecular features.

The year starts with a spectacular result from Laura Kreidberg and colleagues: the super-Earth exoplanet GJ 1214 b has high altitude clouds in its atmosphere.

The image at left shows observations from the Hubble Space Telescope. These data were collected as the planet GJ 1214 b passed in front of (transited) its host star. When that happens, light emitted by the host star passes through the planet’s atmosphere, and the atmosphere can imprint a spectral signature on that light, telling us what it’s made of.

But for GJ 1214 b, as shown by the bottom at left, there were NO spectral signatures — the spectrum is completely flat. The most likely explanation is that the planet has clouds high in its atmosphere that block the star light from passing through the part of the atmosphere where spectral signatures would be imprinted.

To make such a flat spectrum, GJ 1214 b’s clouds have to be very high in its atmosphere. Kreidberg and colleagues estimate the cloud deck can’t be lower than about 1 millibar in pressure. On the Earth, cirrus clouds, some of the highest clouds, live at pressures of about 300 millibars or 10 km in altitude. Earth’s atmospheric pressure doesn’t drop to 1 millibar until an altitude of about 70 km, above a height where meteors typically burn up. So GJ 1214 b’s clouds are very unusual.

Model (top) and observed (bottom) infrared images of the debris disk around HD 15115. From Rodigas+ (2012).

Model (top) and observed (bottom) infrared images of the debris disk around HD 15115. From Rodigas+ (2012).

Great talk today in the astronomy seminar from our own Dr. Timothy Rodigas.

Dr. Rodigas talked about several topics related to debris disks around stars. The colors and shapes of these disks can tell us about the compositions of planet-forming materials around the host stars and about the possible presence of otherwise unseen planets.

Without any planets in the system, debris disks are thought to take on very simple shapes, so if an astronomer finds a disk that warped or asymmetric, that can be evidence for a planet gravitationally sculpting the disk.

Dr. Rodigas presented the results of theoretical calculations that showed how the width of a sculpted debris disk can be used to put an upper limit on the mass of a planetary companion — very useful if you’re an astronomer trying to decide where to look for planets.

This natural color composite was taken during the Cassini spacecraft's April 16, 2005, flyby of Titan. From http://en.wikipedia.org/wiki/Titan_%28moon%29.

This natural color composite was taken during the Cassini spacecraft’s April 16, 2005, flyby of Titan. From http://en.wikipedia.org/wiki/Titan_%28moon%29.

Interesting public talk to the National Capital Astronomers‘ monthly meeting from Prof. Doug Hamilton of UMD Astronomy.

Prof. Hamilton talked about the origin of Saturn’s moon Titan, an unusual satellite in several ways. Titan has a massive nitrogen and methane atmosphere, full of orange photochemical haze (picture at left).

Prof. Hamilton pointed out that that Saturn’s satellite system is also unique among satellite systems of giant planets: unlike the Jovian and Uranian systems, Titan is the only large moon, and it is very far from the next largest moons in the system.

Instead of forming along with its host planet, as the Jovian and Uranian satellites probably did, Prof. Hamilton suggested that several smaller satellites originally formed around Saturn. Then the moons’ orbits destabilized, and the moons collided, merging to form Titan.

This novel hypothesis solves several outstanding questions about Titan and highlights how much we still don’t understand about our own solar system.

Great talk today from Dr. Karl Gordon of the Space Telescope Science Institute (STScI) on mapping interstellar dust in the Milky Way and other galaxies.

Full sky images of dust in the Milky Way from the Pioneer 10/11 IPP data. From http://www.stsci.edu/~kgordon/pioneer_ipp/Pioneer_10_11_IPP.html.

Full sky images of dust in the Milky Way from the Pioneer 10/11 IPP data. From http://www.stsci.edu/~kgordon/pioneer_ipp/Pioneer_10_11_IPP.html.

Dr. Gordon spoke about using observations taken at infrared wavelengths to look for heat radiated by dust grains and then using those measurements to determine how hot the dust is and how much there is. The picture at right shows a map of dust in the Milky Way from one of Dr. Gordon’s papers.

Understanding the dust distributed throughout the Milky Way and other galaxies can tell us a lot about stellar evolution, the galaxies themselves, and about the conditions in those galaxies where the dust lives. And at the most fundamental level, it tells us about the planets and even life itself because the Earth and everything on it formed from this star dust.

Geometry of the mutual occultations of Sila and Nunam (called ``mutual events'') over the last few years. From http://www2.lowell.edu/users/grundy/abstracts/figs/2012.Sila-Nunam.gif.

Geometry of the mutual occultations of Sila and Nunam (called “mutual events”) over the last few years. From http://www2.lowell.edu/users/grundy/abstracts/figs/2012.Sila-Nunam.gif.

Interesting talk today in the DTM Astronomy Seminar from Dr. Anne Verbiscer of UVA Astronomy.

She spoke about the Kuiper Belt binary object Sila-Nunam, two enigmatic bodies orbiting 40 times farther from the Sun than the Earth. They have radii of about 100 km, comparable to some of Saturn’s small moons, and they orbit one another every 12 days, as they both go around the Sun together every 300 years.

In recent and coming years, Sila and Nunam will occult one another several times, allowing astronomers to measure their radii, which aren’t very well known, and learn about their densities, internal structures, and orbit.

Dr. Verbiscer presented several very interesting infrared spectra and observations in visible wavelengths, showing the small dips in light from the system, as one object blocked out the other object. These observations are very challenging because objects are so small and far away, but analysis of these data are ongoing and will tell us about these strange, distant, and cold objects.

Interesting seminar by one of DTM‘s own postdocs, Dr. Liyan Tian.

At a subduction zone, one plate of oceanic lithosphere dives under another plate, which 'dewaters' to plate (blue arrows) into the overlying mantle wedge and produces arc volcanism at the surface. Part of the hydrated mantle wedge frees itself and mixes into surrounding depleted mantle. From Widom, Nature 443, 516-517 (2006).

At a subduction zone, one plate of oceanic lithosphere dives under another plate, which ‘dewaters’ to plate (blue arrows) into the overlying mantle wedge and produces arc volcanism at the surface. Part of the hydrated mantle wedge frees itself and mixes into surrounding depleted mantle. From Widom, Nature 443, 516-517 (2006).

Dr. Tian described how she uses the geochemical compostions of basalt erupted from and near mid-ocean ridges to study the composition and transport of material within the Earth’s mantle.

One element that is particularly important for her studies is lithium (Li). Dr. Tian described how Li is thought to behave chemically within the mantle in a way that allows her to trace the subduction of material into the mantle and show that it is later erupted at a mid-ocean ridge (illustrated at right).

Fig. 3 from Mandel+ (2013) showing the combined-light time series for WASP-12 during transit.

Fig. 3 from Mandel+ (2013) showing the combined-light time series for WASP-12 during transit.

Very cool result that, for some reason, only just appeared in the press. Using the Hubble Space Telescope, Avi Mandell and co-authors detected spectral signatures of water in the atmospheres of several very hot, transiting exoplanets.

The figure at left shows the transit signal for WASP-12 b, a very hot gas giant planet that is so close to its host star that the star may be ripping the planet apart.

To get a sense for how impressive these detections are, consider the following: given the temperature and radius for the host star WASP-17, which is about 1,000 lightyears away, we receive about 1 pico-Watt per square meter from the star here on Earth [ (1.38 R_sun/1000 lightyears)^2 (sigma) (6509 K)^4 ~ 1 pW/m^2].

That’s about the same amount of energy we’d receive from a 1000-Watt lightbulb suspended in space 10,000 km from the Earth [1000 W / 4 pi (10000 km)^2 ~ 1 pW/m^2].

The planet WASP-17 b has a radius roughly a tenth that of its host star, giving a transit depth [(radius of the planet)^2/(radius of the star)^2] of about 1% (as seen in the figure). For comparison, the radius of a standard lightbulb is about 3 cm and that of a fruitfly is about 2 mm.

So being able to measure a spectrum for WASP-17 b in-transit is a bit like watching a fruitfly pass in front of a lit lightbulb at a distance of 10,000 km from Earth and being able to tell what color the fly’s wings are. Very cool stuff.

Mandell’s paper is here: http://adsabs.harvard.edu/abs/2013arXiv1310.2949M.

Interesting talk today from Prof. Hilke Schlichting of MIT’s Earth, Atmospheric and Planetary Sciences Dept. She discussed what we can learn about the histories and origins of planets with all the new planets and planetary candidates found by the Kepler mission.

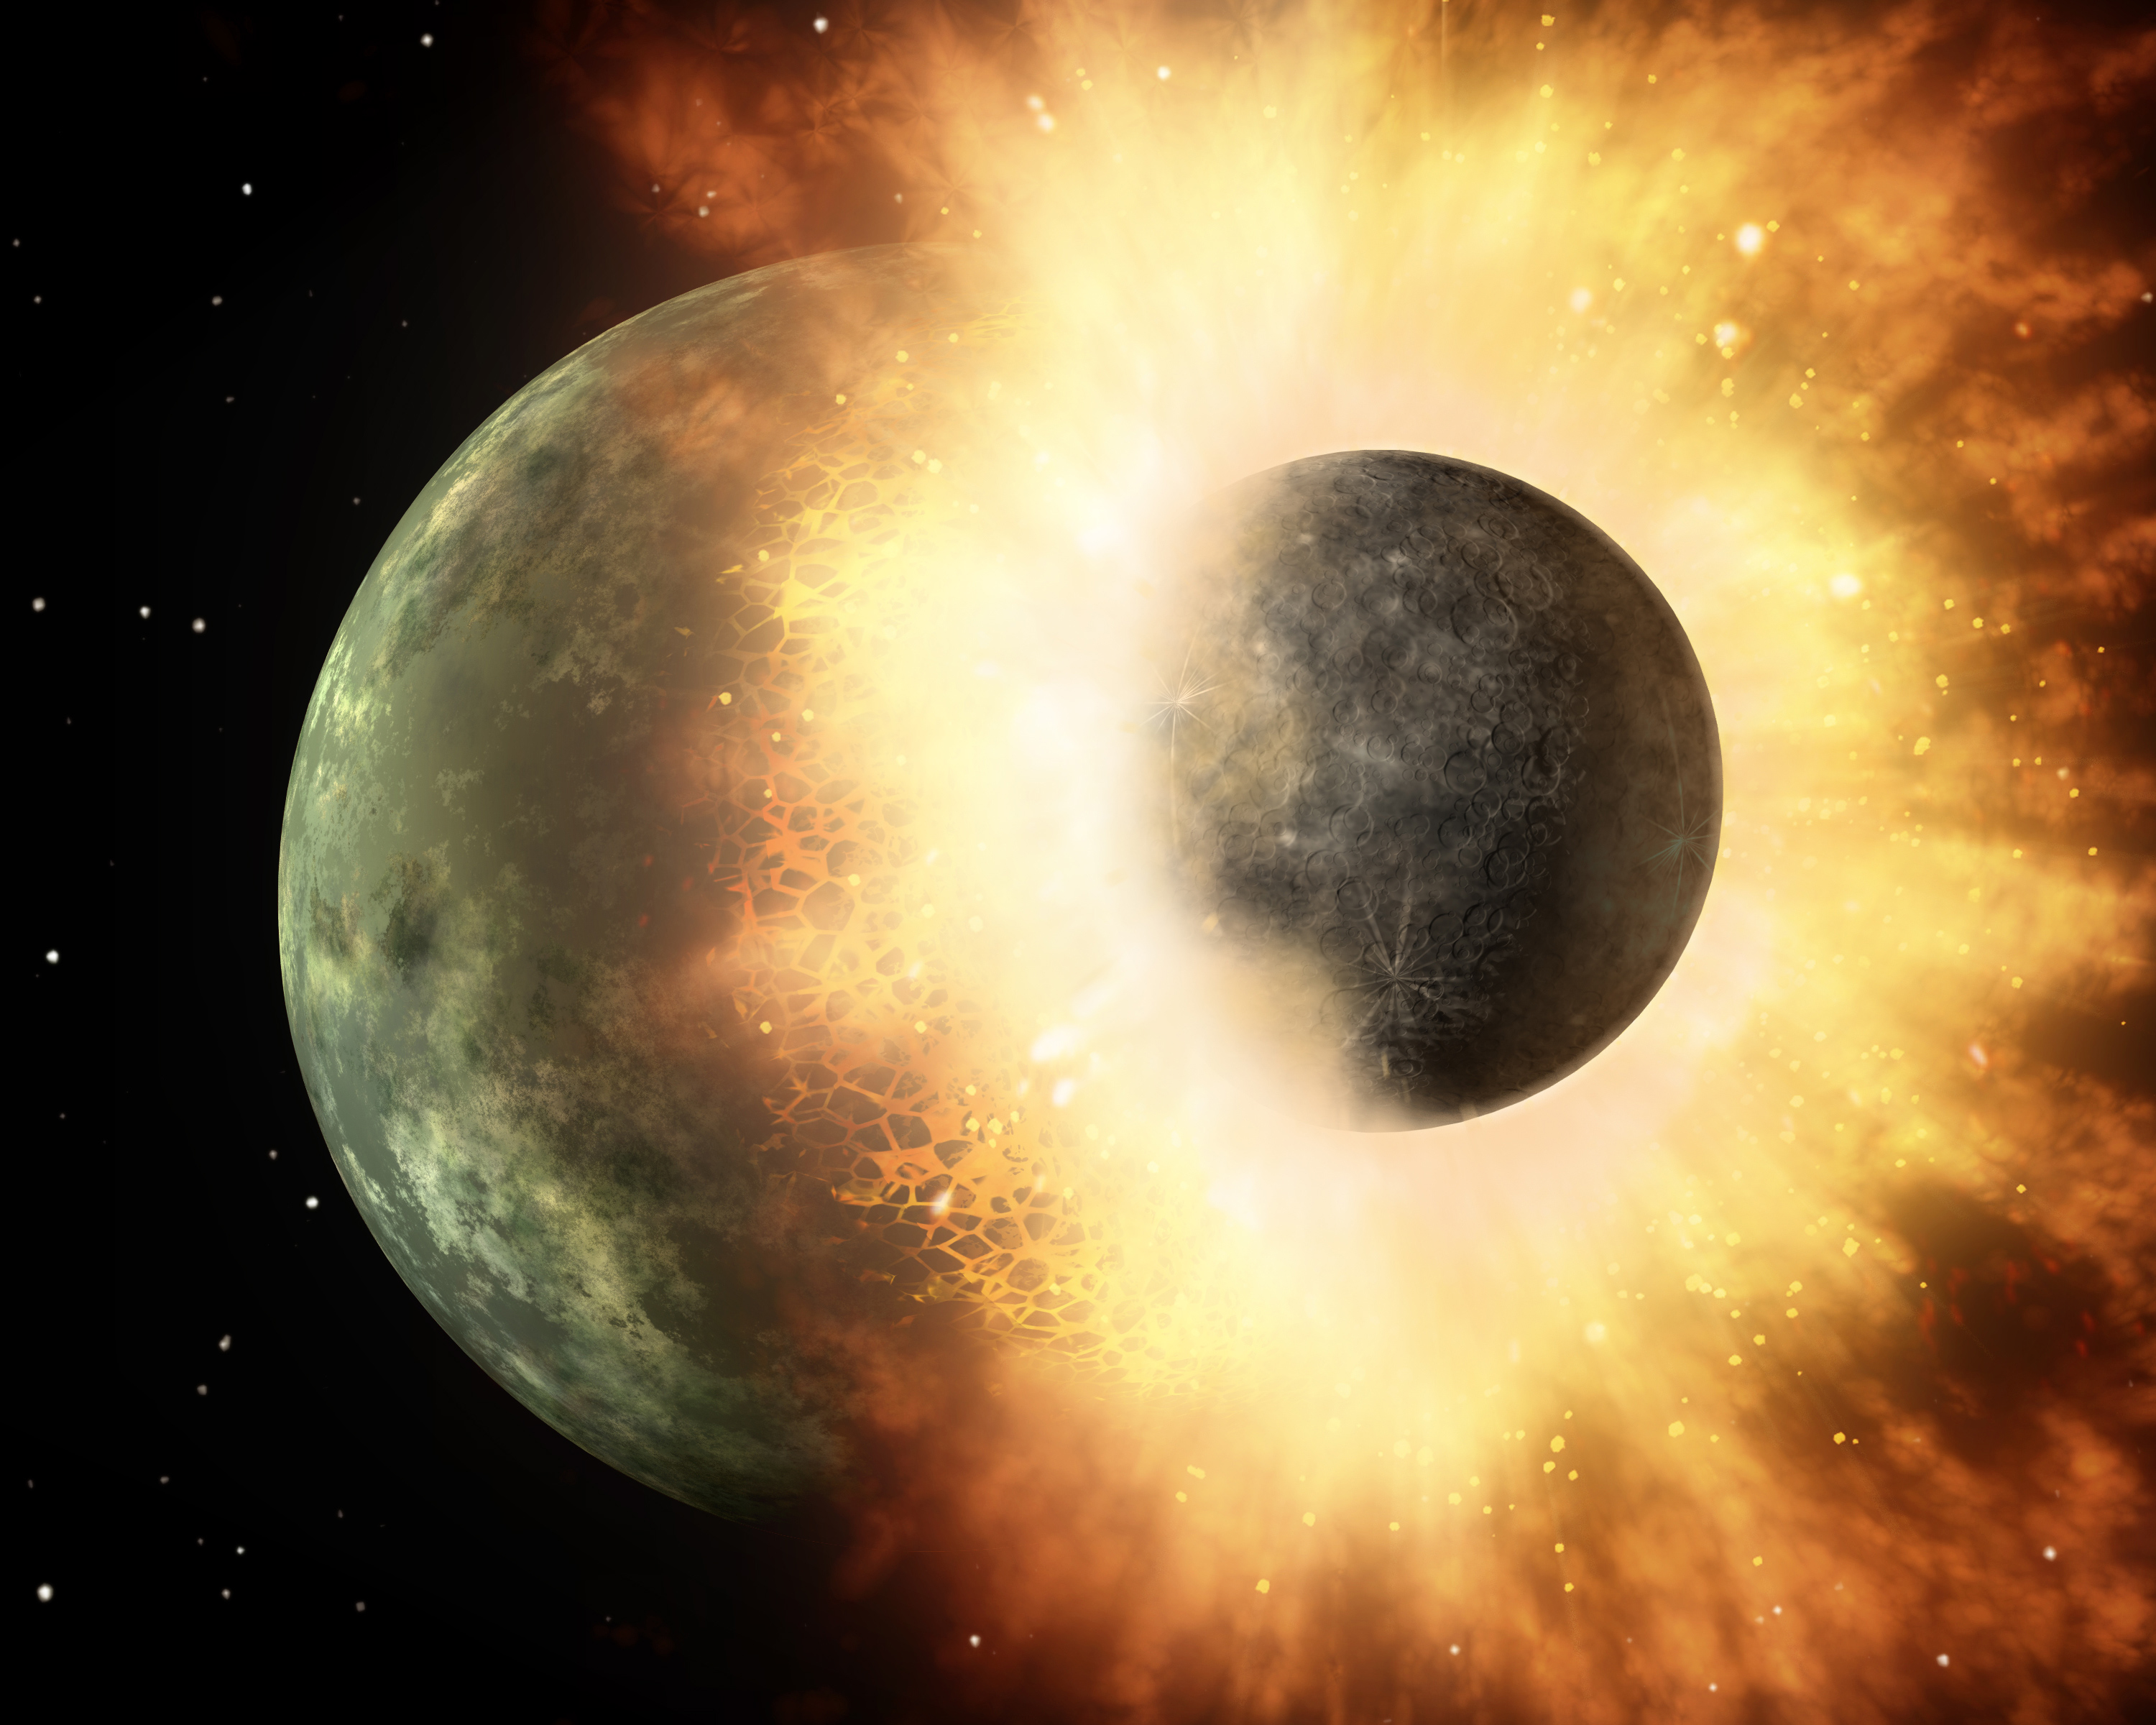
Artist's conception of a large planetary impact. From http://www.hdwallpapersinn.com/planet-impact-wallpapers.html.

Artist’s conception of a large planetary impact of the kind that occurred during planet formation. From http://www.hdwallpapersinn.com/planet-impact-wallpapers.html.

Among the key results from Kepler are discoveries of a wide variety of orbital architectures (the arrangements of planetary orbits). The processes that gave rise to the planets determined, for example, the orbital periods of the planets.

Many Kepler planets reside in systems with multiple planets, and many members of these multiplanet systems have orbital periods that are very nearly integer multiples of one another. That is, the planets are near a mean-motion resonance, which means the planets interact strongly gravitationally.

Prof. Schlichting described one explanation for these near resonances: while the planetary systems were still very young, interactions between the nascent planets and the protoplanetary gas disks from which the planets form gently tuned the gravitational interactions between the planets, keeping them slightly out of resonance.

There has been some debate about whether the near resonances for many Kepler planetary systems mean that the planets did or did not undergone strong gas disk migration. In the simplest picture, this migration should drive planets into resonances, inconsistent with the observations of near-resonances.

But Prof. Schlichting’s modification to that picture means that the planets could have undergone migration after all. Turns out planetary systems were pretty complicated, dynamic places early on.

P/2013 P5 as seen by Hubble on September 10, 2013. P/2013 P5 is about 790 feet (240 m) in diameter. It has six comet-like tails of dust radiating from it like spokes on a wheel. From http://www.sci-news.com/space/science-p2013p5-hubble-asteroid-six-tails-01530.html.

The comet P/2013 P5 as seen by Hubble on September 10, 2013. P/2013 P5 is about 790 feet (240 m) in diameter. It has six comet-like tails of dust radiating from it like spokes on a wheel. From http://www.sci-news.com/space/science-p2013p5-hubble-asteroid-six-tails-01530.html.

At journal club today, we talked about two interesting papers.

The first, “The Extraordinary Multi-tailed Main-belt Comet P/2013 P5” by Jewitt and colleagues, discussed observations using the Hubble Space Telescope of a comet in the asteroid belt that displayed five cometary tails (see image at left). The tails are made of particles shed by the comet, and using the particle trajectories inferred from the tails, the authors were able to figure out when, over the last few months, the particles were launched from the comet.

The second article, “Evidence for high salinity of Early Cretaceous sea water from the Chesapeake Bay crater” by Sanford and colleagues, presented chemical analyses of water collected from under the Chesapeake Bay, in the large impact crater at the southern end of the bay. (The crater is underwater and buried by sediment, so you can’t see it even if you’re just standing on it.) The water contain subtle chemical signatures that indicate it was originally part of the Early Cretaceous North Atlantic Ocean, an extinct ocean from more than 100 million years ago. Chemical analyses of this buried water will tell scientists what the ancient ocean was like.